
Mining
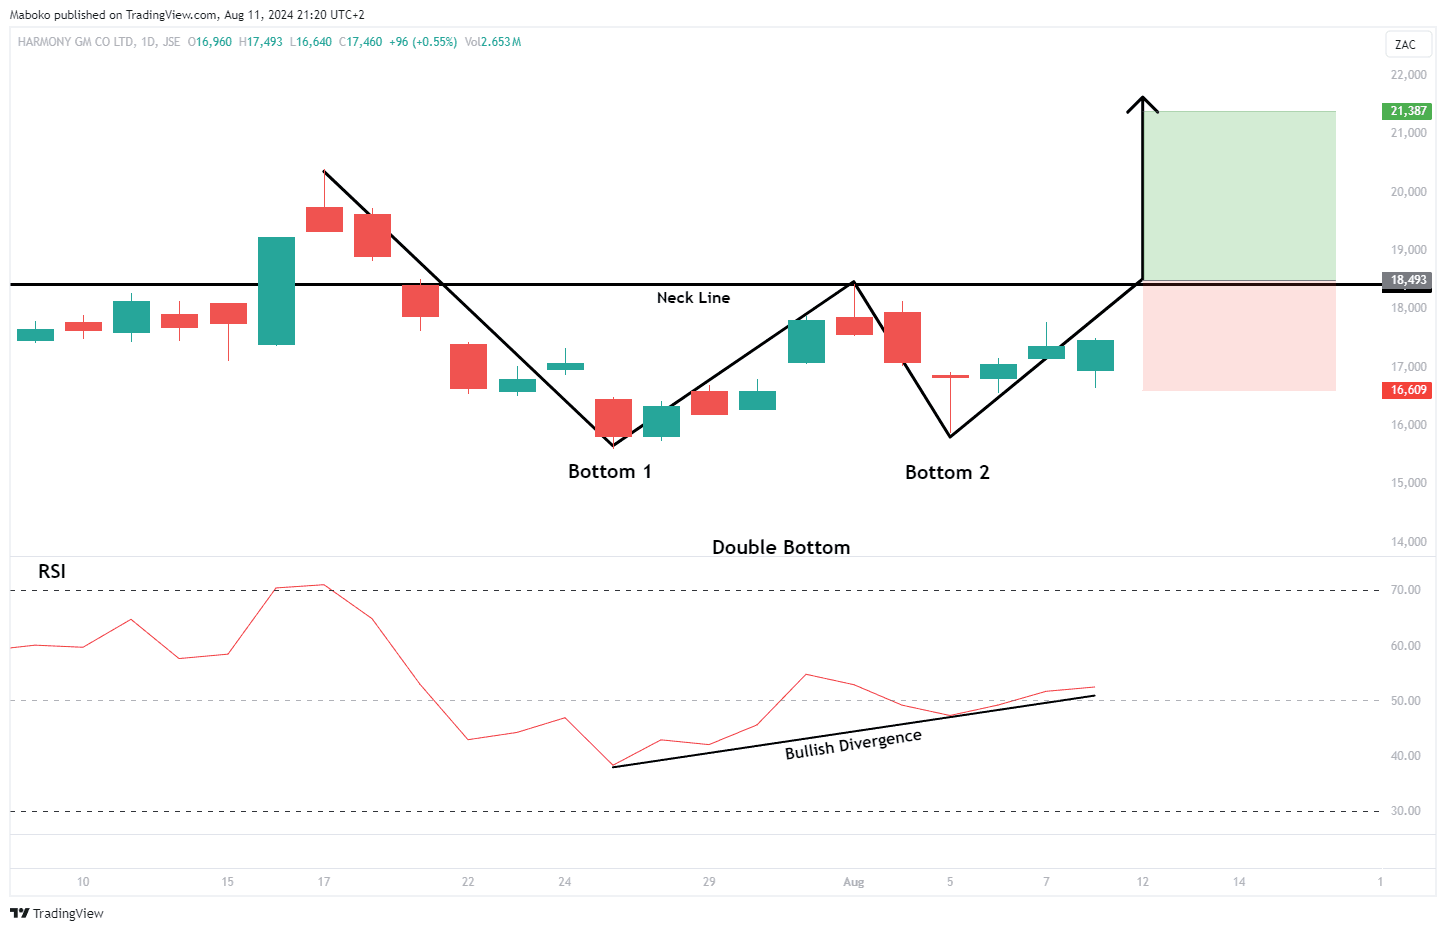
Harmony Gold Mining Co. Ltd. (HAR): Harmony Gold Mining Co. Ltd. is in the mining and exploration of gold. It involves building mines, open-pit operation, sales, financial management, land rehabilitation and mine closure.
A double bottom is a bullish reversal pattern that indicates a potential shift from a downtrend to an uptrend. It is characterized by two distinct lows that occurred at R158.61 level, separated by a resistance level known as the neck line at R184.28. The second bottom formed at a similar level as the first, it suggests that selling pressure has diminished and buyers are stepping in. A breakout above the neck line, confirms the pattern and signals a potential upward movement. Additionally, a bullish divergence is occurring on the Relative strength indicator (RSI), suggesting momentum to the downside is fading and favouring the upward momentum.
A potential Buy/Long idea can be initiated once the price closes above R184.28 with a take profit (TP) set at R213.87 and the stop loss (SL) set at R166.09.
#HAR
Transportation
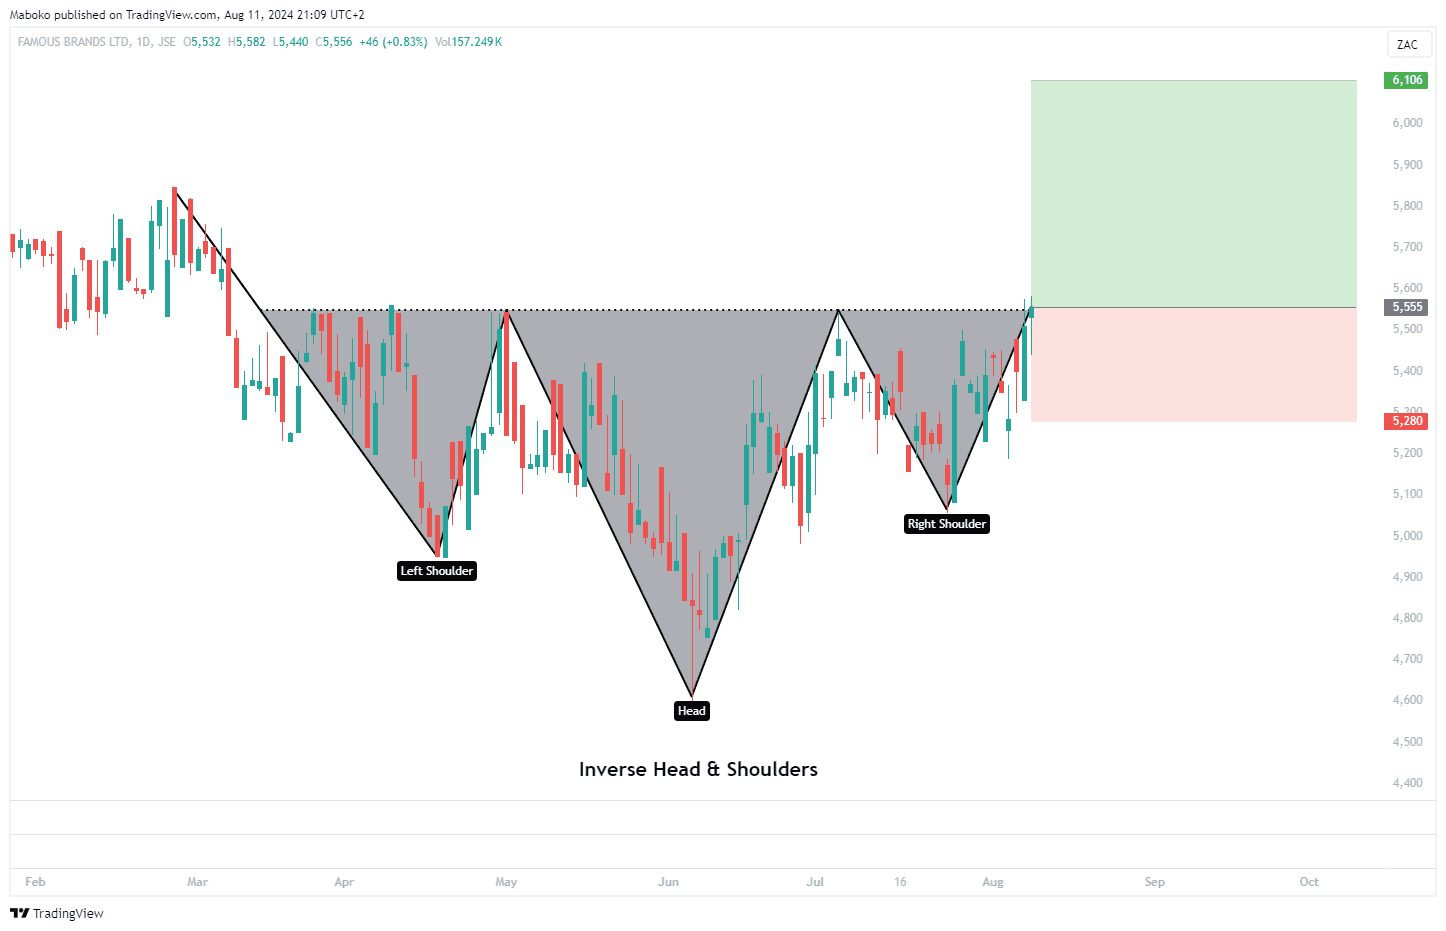
Famous Brands Ltd. (FBR): Famous Brands Ltd. is in the business of management of a chain of restaurants and franchising. The firm manufactures and supplies its franchisees, the retail trade and the hospitality industry with a range of meat, sauces, bakery, ice cream, fruit juice, and mineral water products.
The inverse head and shoulders is a bullish reversal pattern, indicating a potential shift from a downtrend to an uptrend. It consists of three troughs: the left shoulder, the head, and the right shoulder. The head being the lowest point at R46.16 is flanked by two higher troughs (the shoulders), which are roughly at R50.65 level. The pattern is completed by a neckline at R55.51, which connects the peaks between the head and shoulders. A breakout above the neck line confirms the reversal and signals a potential upward movement. The pattern suggests that the selling pressure is weakening and buyers are gaining control, often leading to a rally.
A potential buy/long idea can be initiated with a take profit (TP) set at R61.06 and the stop loss (SL) set at R52.80.
#FBR
Health Technology
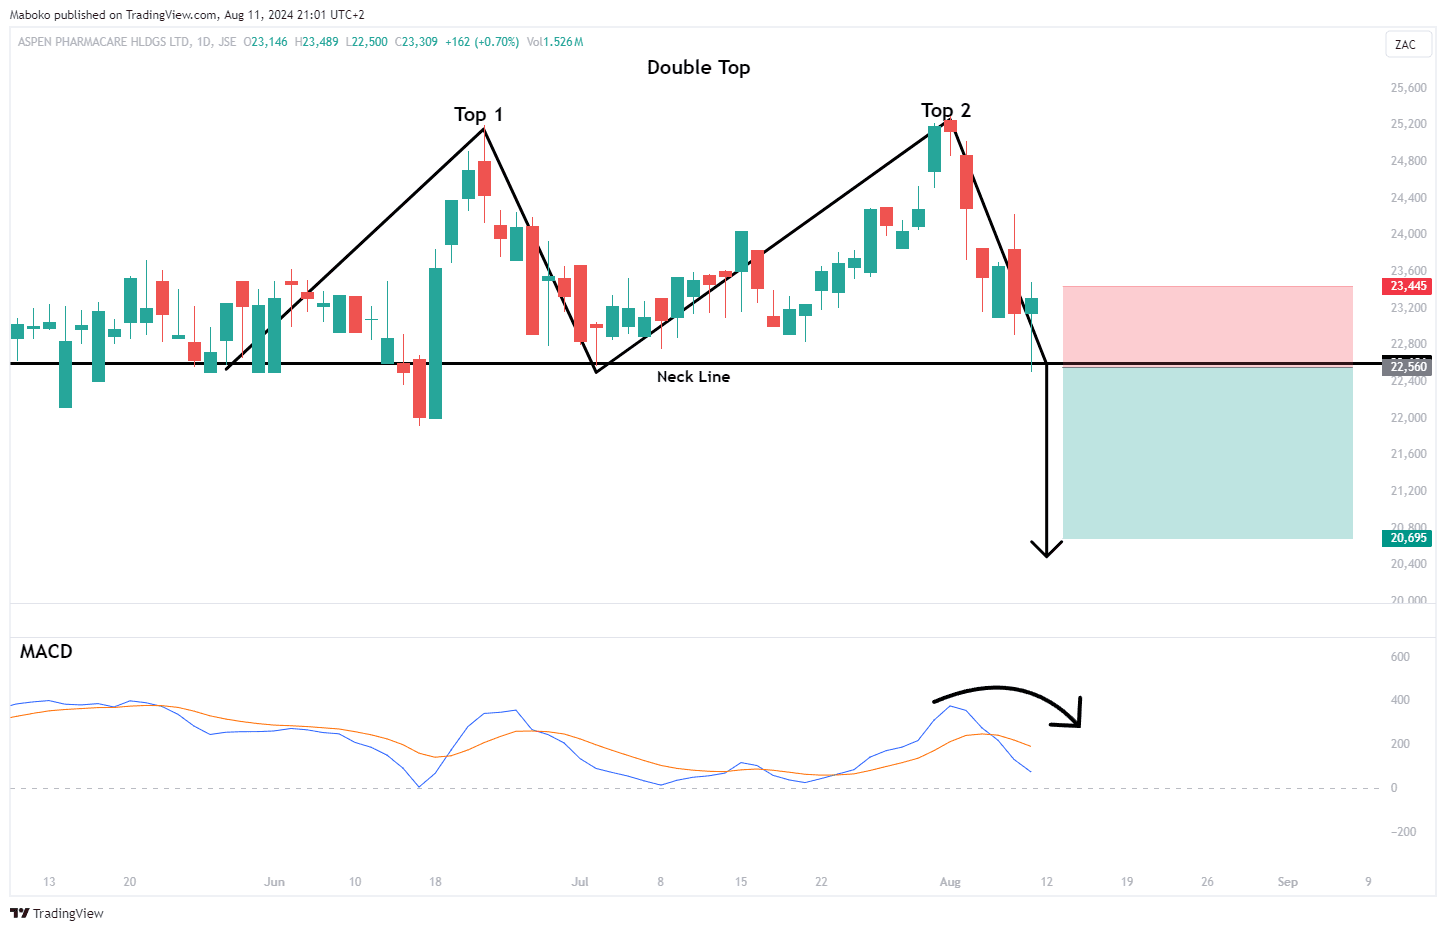
Aspen Pharmacare Holdings Ltd. (APN): Aspen Pharmacare Holdings Ltd. manufactures and supplies branded and generic pharmaceutical products. It operates through Commercial Pharmaceuticals and Manufacturing.
A double top is a bearish reversal pattern that signals a potential shift from an uptrend to a downtrend. It is characterized by two peaks that occur at R252.19, separated by support level (neck line) at R226.06. The first peak forms as the price rises, indicating strong buying pressure. However, after the price retreats to form the neck line and then attempts to rise again but fails to break above the level of the first top, forming the second top. This failure suggests that buying pressure is weakening and that sellers are gaining control. The pattern is confirmed when the price breaks below the neckline, which often triggers a sharp decline. The Moving Average Convergence Divergence (MACD) has made a bearish crossunder, suggesting momentum to the downside is applicable.
A speculative sell/short idea can be initiated with a take profit (TP) set at R206.95 and the stop loss (SL) set at R234.45.
#APN
Consumer Services
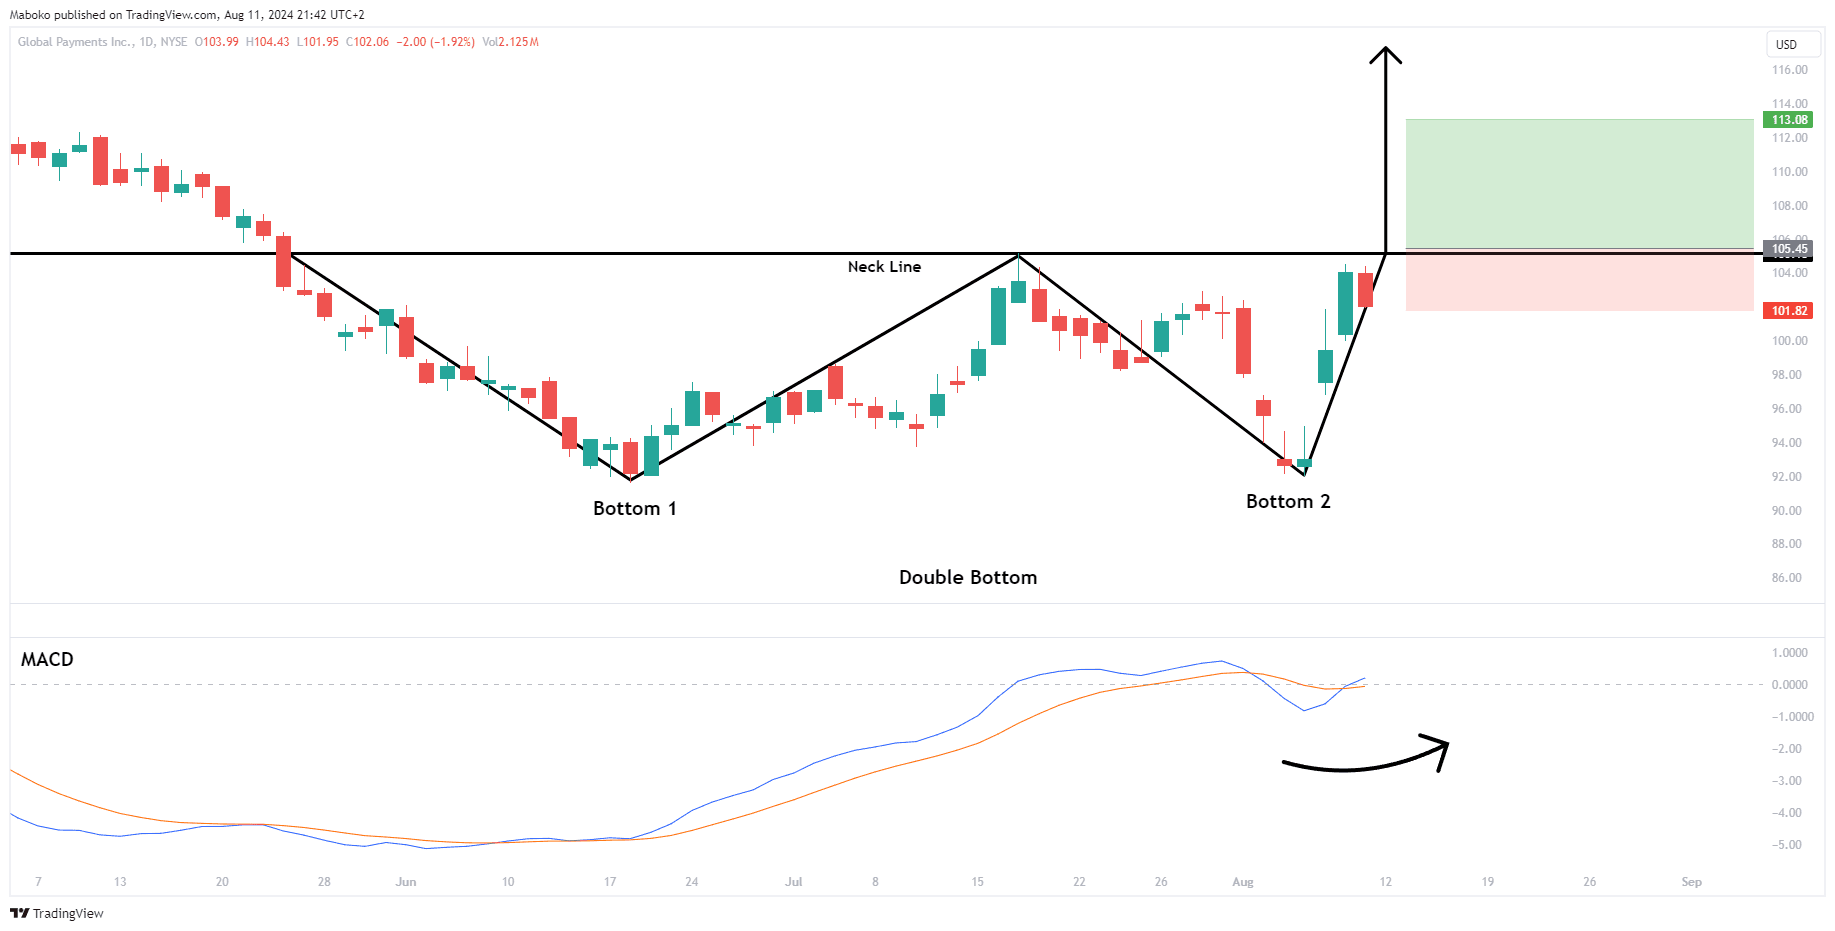
Global Payments, Inc. (GPN): Global Payments, Inc. is in the business of payment technology and software solutions.
A double bottom is unfolding, suggesting a bullish reversal pattern that indicates a potential shift from a downtrend to an uptrend. It has two lows, which occurred at $92 region, separated by the neck line at $105.18.The Moving Average Convergence Divergence (MACD) has made a bullish crossover, suggesting momentum to the upside is applicable.
A speculative Buy/Long idea can be initiated once price closes above the $105.18 with a take profit (TP) set at $113.08 and the stop loss (SL) set at $101.82.
#GPN
Health Technology
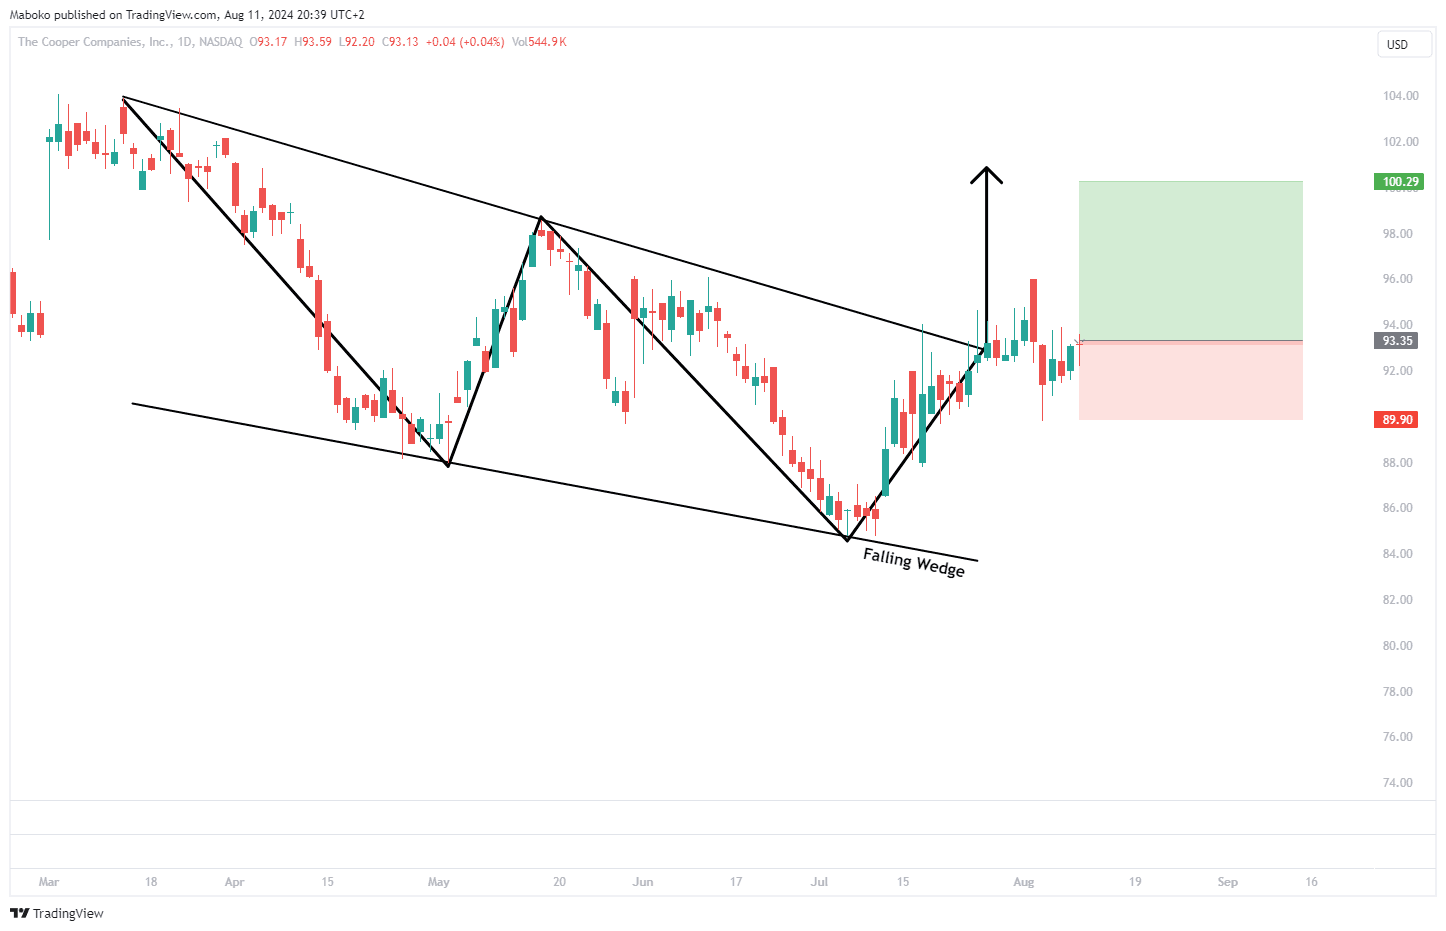
The Cooper Cos, Inc. (COO): The Cooper Cos, Inc. operates as a medical device company. It operates through the Cooper Vision and Cooper Surgical segments.
A falling wedge is a bullish continuation or reversal pattern, indicating a potential upward price movement. The pattern is formed by two converging trend lines that slope downward, with the upper trendline representing a series of lower highs and the lower trendline representing lower lows. A breakout above the upper trendline at $93.21 confirmed the pattern and signals a potential price rally.
A speculative Buy/Long can be initiated, with a take profit (TP) set at $100.29 and the stop loss (SL) set at $89.90.
#COO
Producer Manufacturing
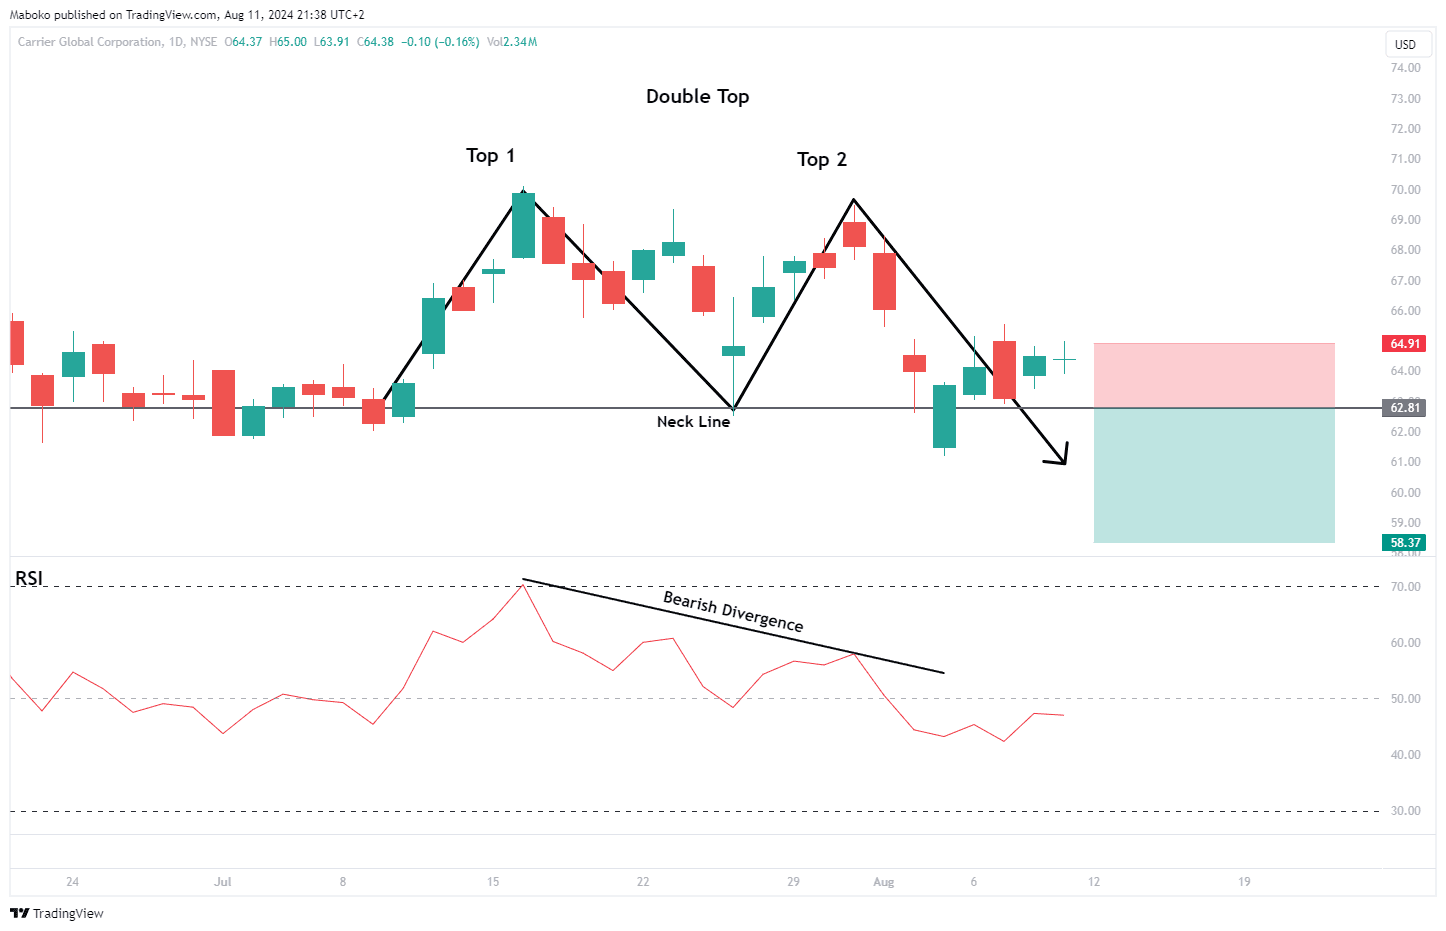
Carrier Global Corp. (CARR): Carrier Global Corp. is in the business of building and cold chain solutions. It also offers heating, ventilating, air conditioning (HVAC), refrigeration, fire, security and building automation technologies.
A double top is a bearish reversal pattern that signals a potential shift from an uptrend to a downtrend. It has two peaks that occurred at $70 region, separated by the neck line at $62.81.A bearish divergence on the Relative strength indicator (RSI), suggesting momentum to the upside is fading and favouring the downward momentum.
A speculative sell/short idea can be initiated once the price closes below $62.81 with a take profit (TP) set at $58.37 and the stop loss (SL) set at $64.91.
#CARR
Disclaimer: Any opinions, views, analysis or other information provided in this article is provided by BCS Markets SA trading as BROKSTOCK as general market commentary and should not be viewed as advice according to the FAIS Act of 2002. BCS Markets SA does not warrant the correctness, accuracy, timeliness, reliability or completeness of any information provided by third parties. You must rely upon your judgement in all aspects of your investment decisions and all decisions are made at your own risk. BCS Markets SA and any of its employees shall not be responsible for and will not accept any liability for any direct or indirect loss including without limitation any loss of profit which may arise directly or indirectly from use of the market commentary. The content contained within the article is subject to change at any time without notice. BCS Markets SA is an authorized financial services provider FSP No. 51404.