JSE & NYSE Shares Analysis | 15-19 April

JSE SHARES
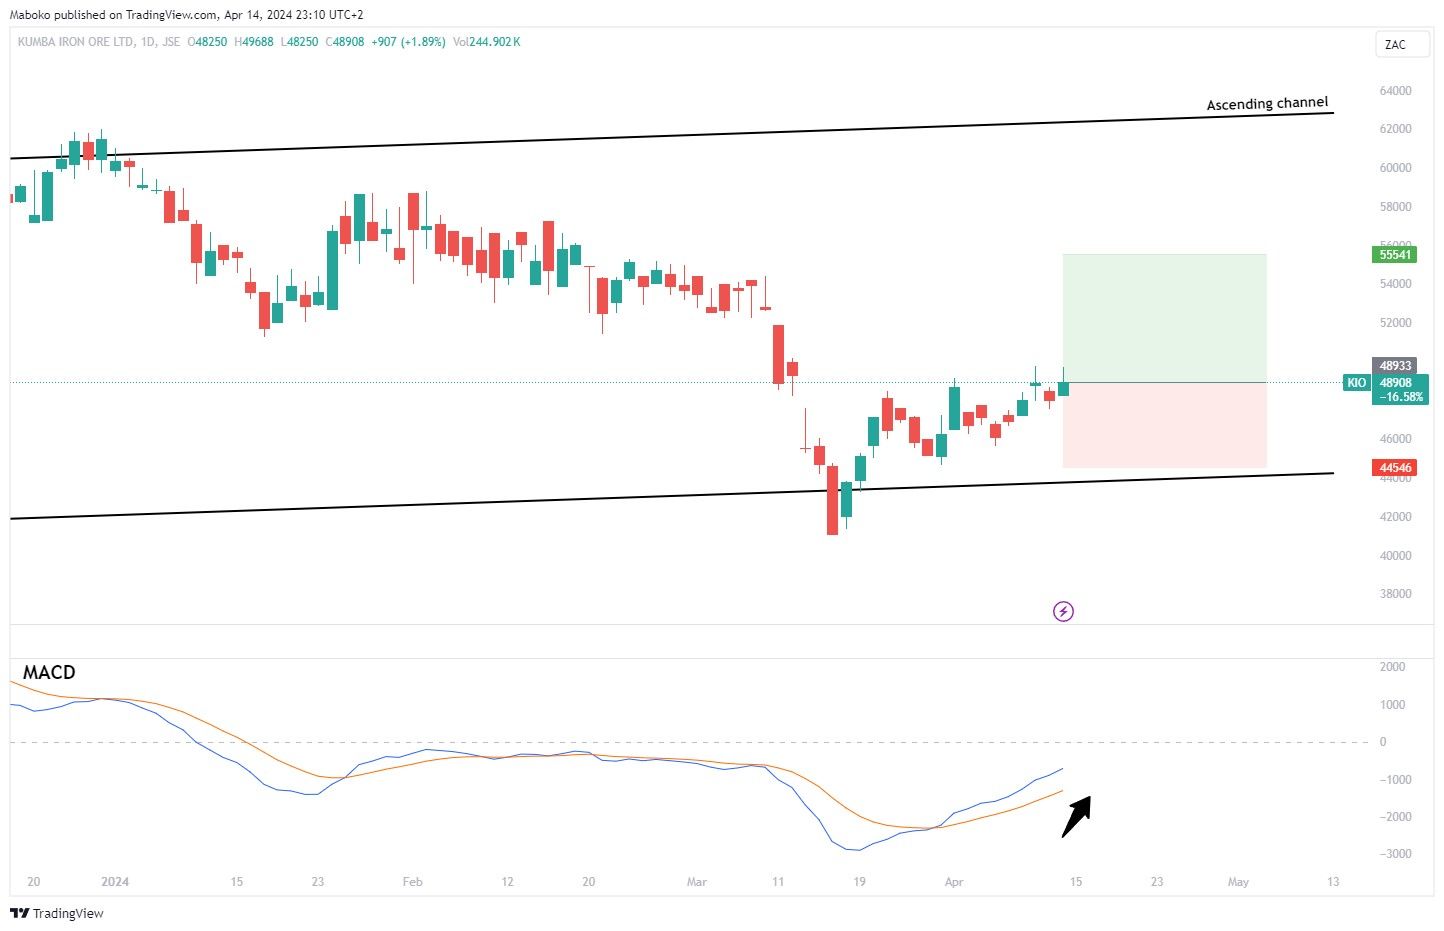
• Kumba Iron Ore Ltd (KIO) | Mining: Kumba Iron Ore is in the business of extraction, production, and sale of iron ore.
The share price has been in an ascending channel, it has recently tested the lower bound of the channel at R430 region, the price has since bounced off the levels heading higher again. The MACD has crossed over for bullish momentum
A buy/long idea can be initiated with a take profit (TP) set at R555.41 and the stop loss (SL) set at R445.46.
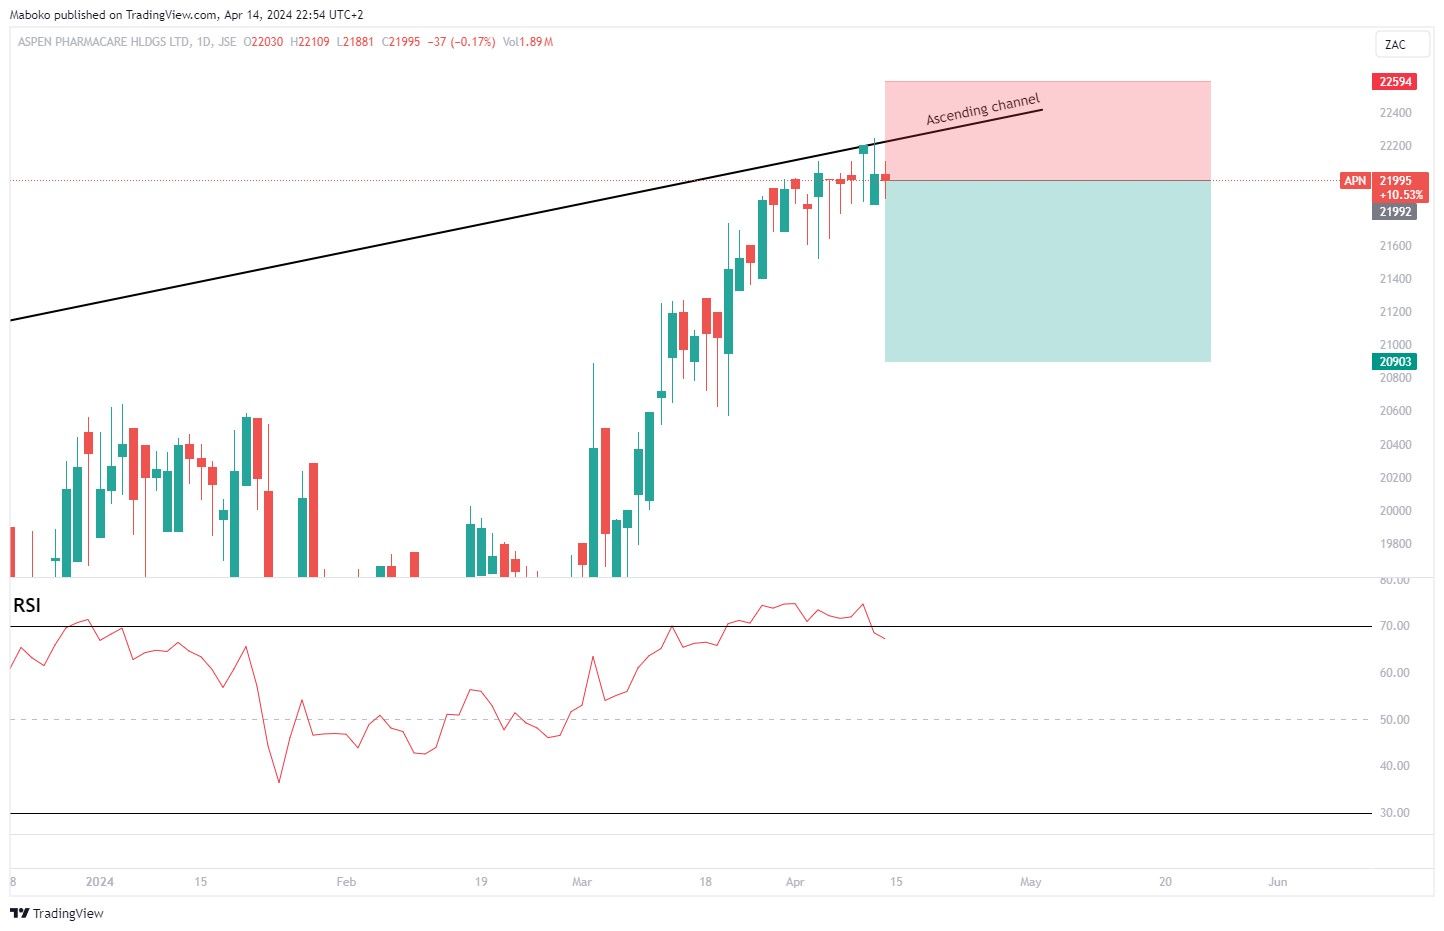
• Aspen
Pharmacare Holdings Ltd (APN) | Health Technology: Aspen Pharmacare manufactures and supplies branded and generic pharmaceutical products. It operates through Commercial Pharmaceuticals and
Manufacturing.
A buy/long idea was released in the last week of February, and it has breached take profit. The share price has tested the upper bound at regions of R220. RSI has reached the oversold territory, suggesting that momentum might cool off to the downside.
A speculative sell/short can be initiated with a take profit (TP) set at R209.03 and stop loss (SL) set at R225.94.
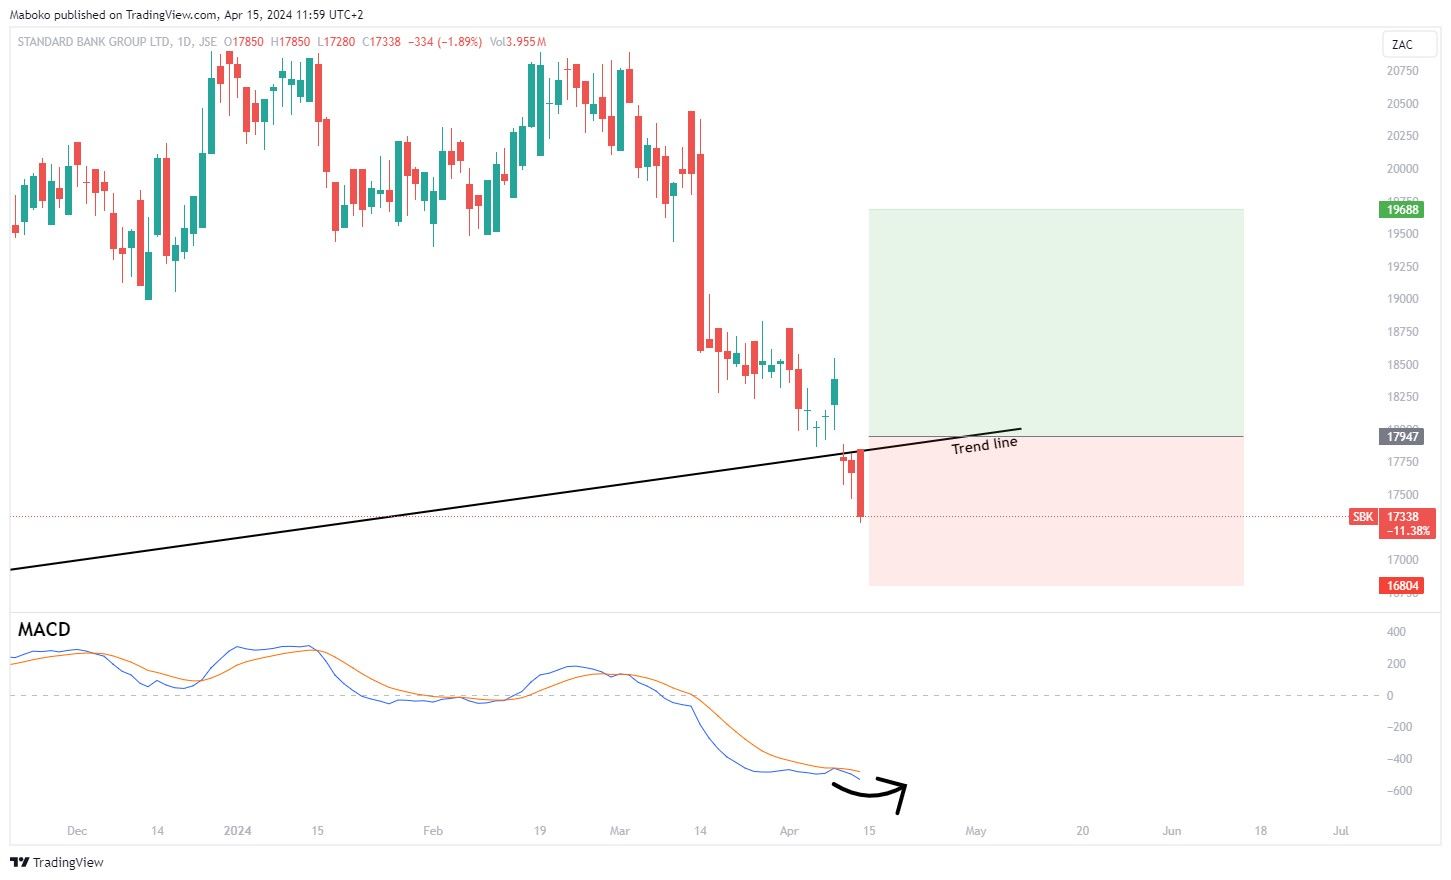
• Standard Bank Group Ltd (SBK) | Finance: Standard Bank Group is a holding company, which is in the business
of providing integrated financial and related solutions to clients.
The share price has respected the trend line since the low of May 2020, The price has been making higher highs and lower highs using the trend line as a support level. The price is currently trading below the trend line. The MACD is yet to signal a bullish crossover.
A buy/long can be initiated once the price closes above the trend line and a MACD crossover signal has taken place, a take profit (TP) set at R196.88 and stop loss (SL) set at R168.04.
US STOCKS
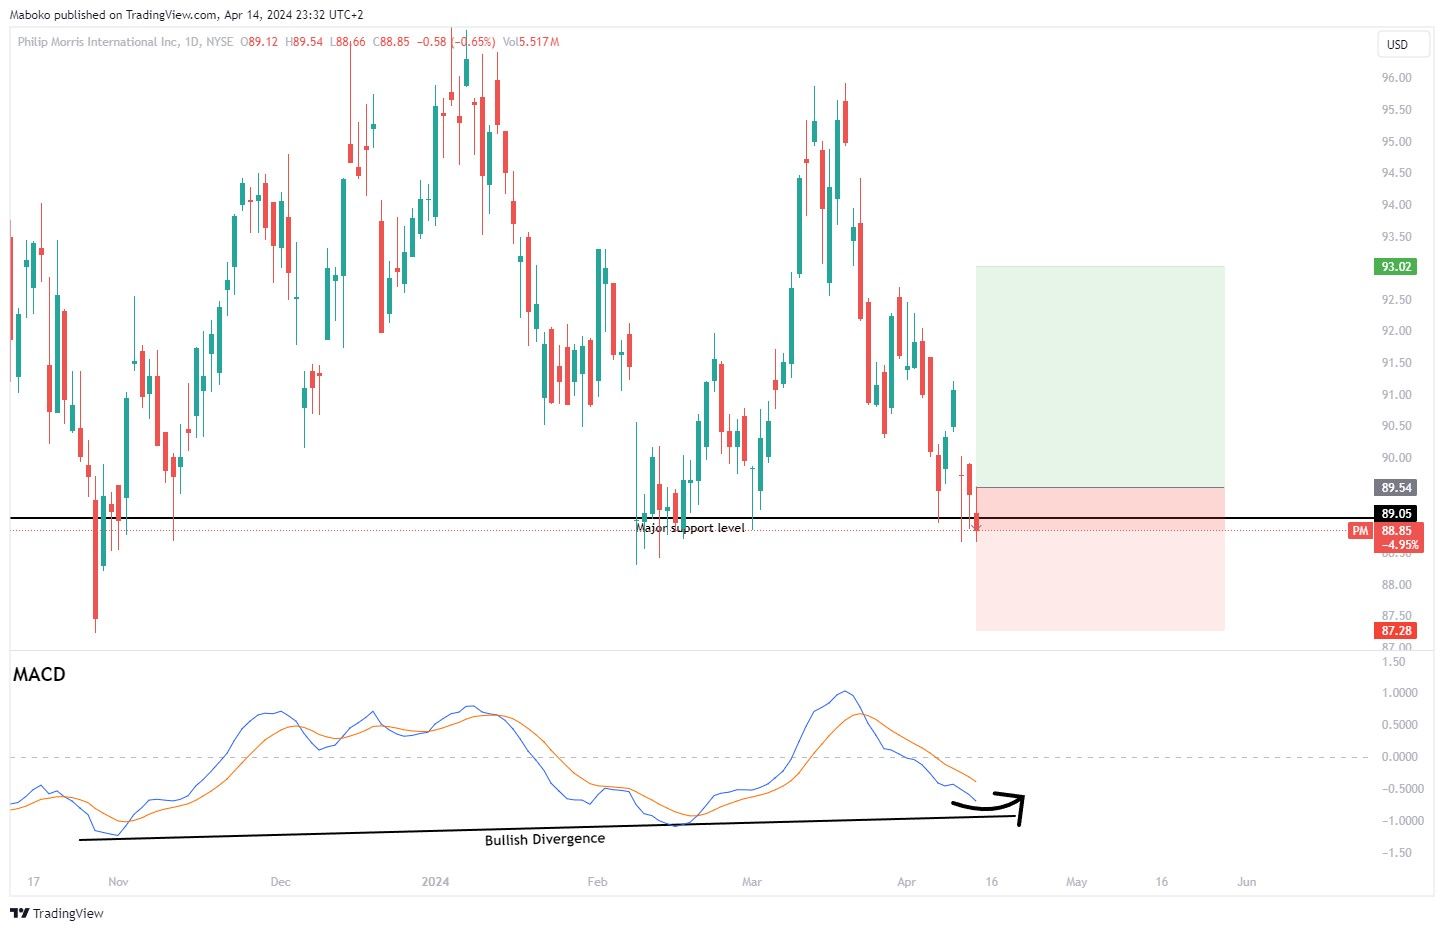
• Philip Morris International, Inc (PM) | Consumer non-durables: Philip Morris International, Inc. is a holding company, which is in the business of delivering a smoke free future and evolving a portfolio for the long term to include products outside of the tobacco and nicotine sector.
The share price is currently trading at $88.85, testing the major support level at $89.05. The share has tested the support level twice before and bounced back up to reach highs of $95.00. The MACD has been signalling a bullish divergence with each testing of the support level, signalling a change in momentum to the upside.
A buy/long idea can be initiated once the share closes above the support level at $89.05 with a take profit (TP) set at $93.02 and the stop loss (SL) set at $87.28.
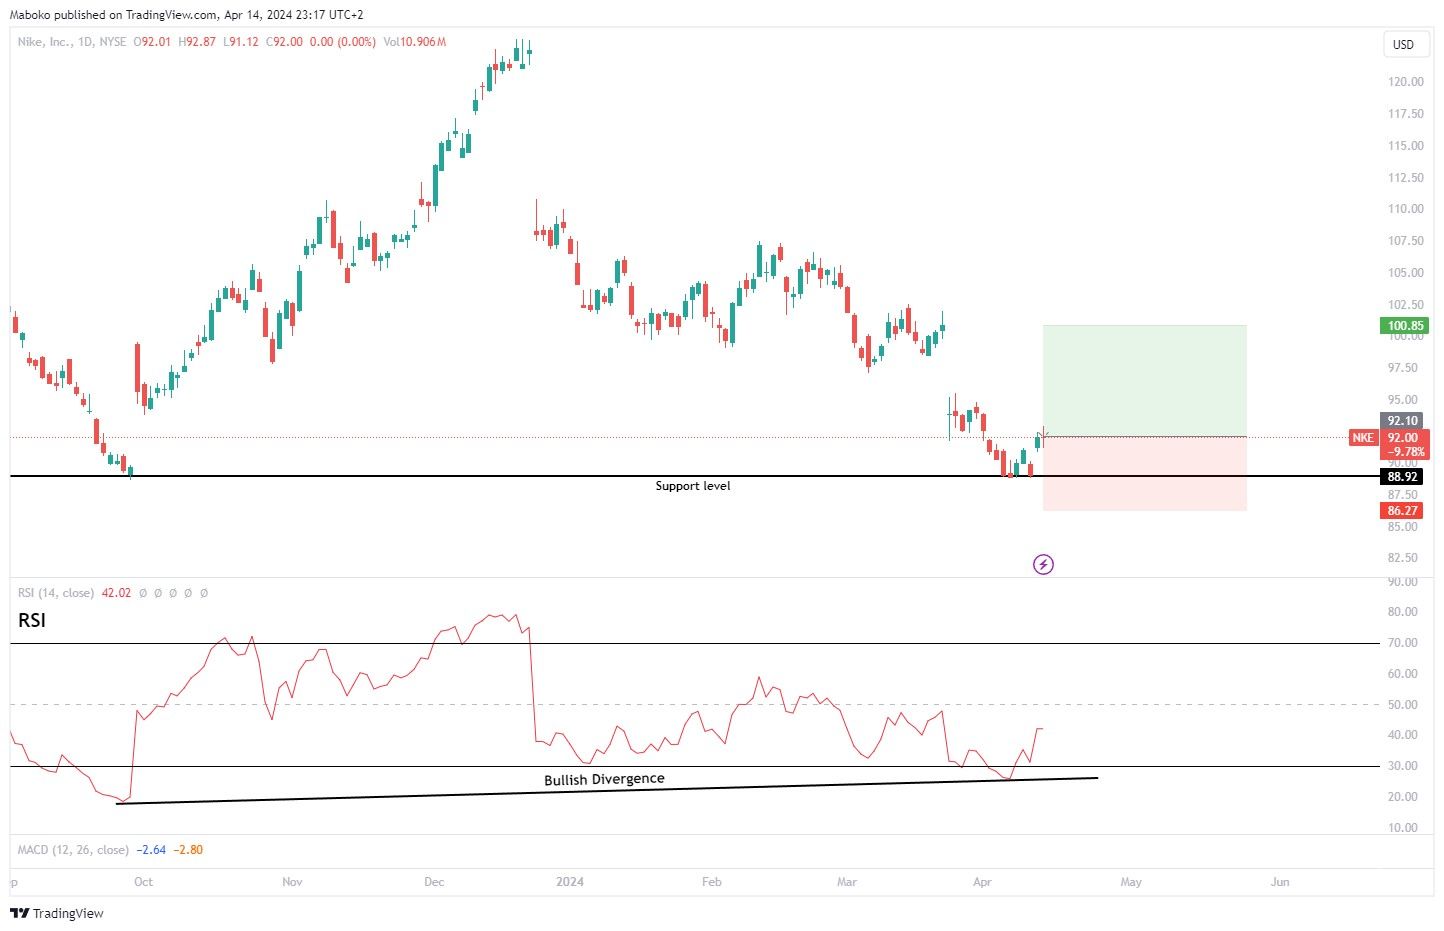
• NIKE,
Inc (NKE) | Consumer non-durables : NIKE is in the business of design, development, marketing and
sales of athletic footwear, apparel, accessories, equipment, and services.
The share price has tested the support level at $88.92 in the beginning of April, with the current price trading at $92.00. The RSI bullish divergence developing across the support level also suggests that momentum to the downside is fading and a long uptrend might develop from this level.
A buy/long can be initiated with a take profit (TP) set at $100.85 and stop loss (SL) set at $86.27.
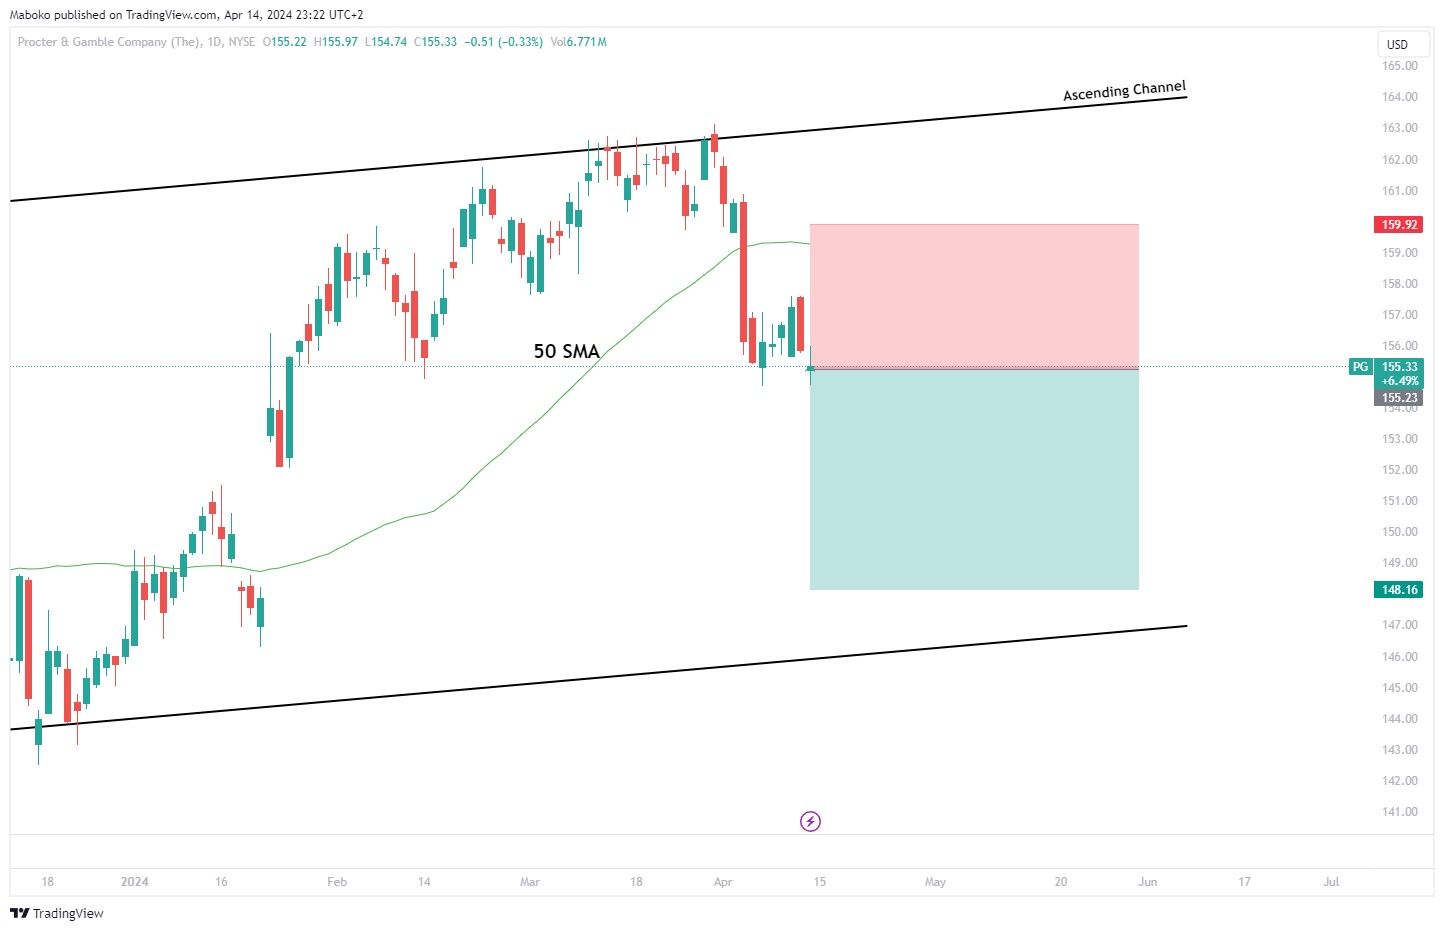
• Procter
& Gamble Co (PG) | Consumer non-durables: Procter & Gamble Co. is in the business of branded
consumer packaged goods. It operates through beauty, grooming, health care,
fabric and home care, and Baby, Famine and Family Care.
Since December 2022 the share price has been steadily heading higher in an ascending channel. The price tested the upper bound of the channel and started descending, it has closed below the 50-day SMA, which has historically showcased continued movement in the direction.
A speculative sell/short can be initiated with a take profit (TP) set at $148.16 and stop loss (SL) set at $159.92.
Disclaimer:
Any opinions,
views, analysis or other information provided in this article is provided by
BCS Markets SA trading as BROCKSTOCK as general market commentary and should
not be viewed as advice according to the FAIS Act of 2002. BCS Markets SA does
not warrant the correctness, accuracy, timeliness, reliability or completeness
of any information provided by third parties. You must rely upon your judgement
in all aspects of your investment decisions and all decisions are made at your
own risk. BCS Markets SA and any of its employees shall not be responsible for
and will not accept any liability for any direct or indirect loss including
without limitation any loss of profit which may arise directly or indirectly
from use of the market commentary. The content contained within the article is
subject to change at any time without notice. BCS Markets SA is an authorized
financial services provider FSP No. 51404.


BCS Markets SA (Pty) Ltd. is an authorized Financial Service Provider and is regulated by the South African Financial Sector Conduct Authority (FSP No.51404). BCS Markets SA Proprietary Limited trading as BROKSTOCK.
The materials on this website (the “Site”) are intended for informational purposes only. Use of and access to the Site and the information, materials, services, and other content available on or through the Site (“Content”) are subject to the laws of South Africa.
Risk notice Margin trading in financial instruments carries a high level of risk, and may not be suitable for all users. It is essential to understand that investing in financial instruments requires extensive knowledge and significant experience in the investment field, as well as an understanding of the nature and complexity of financial instruments, and the ability to determine the volume of investment and assess the associated risks. BCS Markets SA (Pty) Ltd pays attention to the fact that quotes, charts and conversion rates, prices, analytic indicators and other data presented on this website may not correspond to quotes on trading platforms and are not necessarily real-time nor accurate. The delay of the data in relation to real-time is equal to 15 minutes but is not limited. This indicates that prices may differ from actual prices in the relevant market, and are not suitable for trading purposes. Before deciding to trade the products offered by BCS Markets SA (Pty) Ltd., a user should carefully consider his objectives, financial position, needs and level of experience. The Content is for informational purposes only and it should not construe any such information or other material as legal, tax, investment, financial, or other advice. BCS Markets SA (Pty) Ltd will not accept any liability for loss or damage as a result of reliance on the information contained within this Site including data, quotes, conversion rates, etc.
Third party content BCS Markets SA (Pty) Ltd. may provide materials produced by third parties or links to other websites. Such materials and websites are provided by third parties and are not under BCS Markets SA (Pty) Ltd.'s direct control. In exchange for using the Site, the user agrees not to hold BCS Markets SA (Pty) Ltd., its affiliates or any third party service provider liable for any possible claim for damages arising from any decision user makes based on information or other Content made available to the user through the Site.
Limitation of liability The user’s exclusive remedy for dissatisfaction with the Site and Content is to discontinue using the Site and Content. BCS Markets SA (Pty) Ltd. is not liable for any direct, indirect, incidental, consequential, special or punitive damages. Working with BCS Markets SA you are trading share CFDs. When trading CFDs on shares you do not own the underlying asset. Share CFDs are complex instruments and come with a high risk of losing money rapidly due to leverage. A high percentage of retail traders accounts lose money when trading CFDs with their provider. All rights reserved. Any use of Site materials without permission is prohibited.