JSE & NYSE Shares Analysis | 15-19 July

JSE SHARES
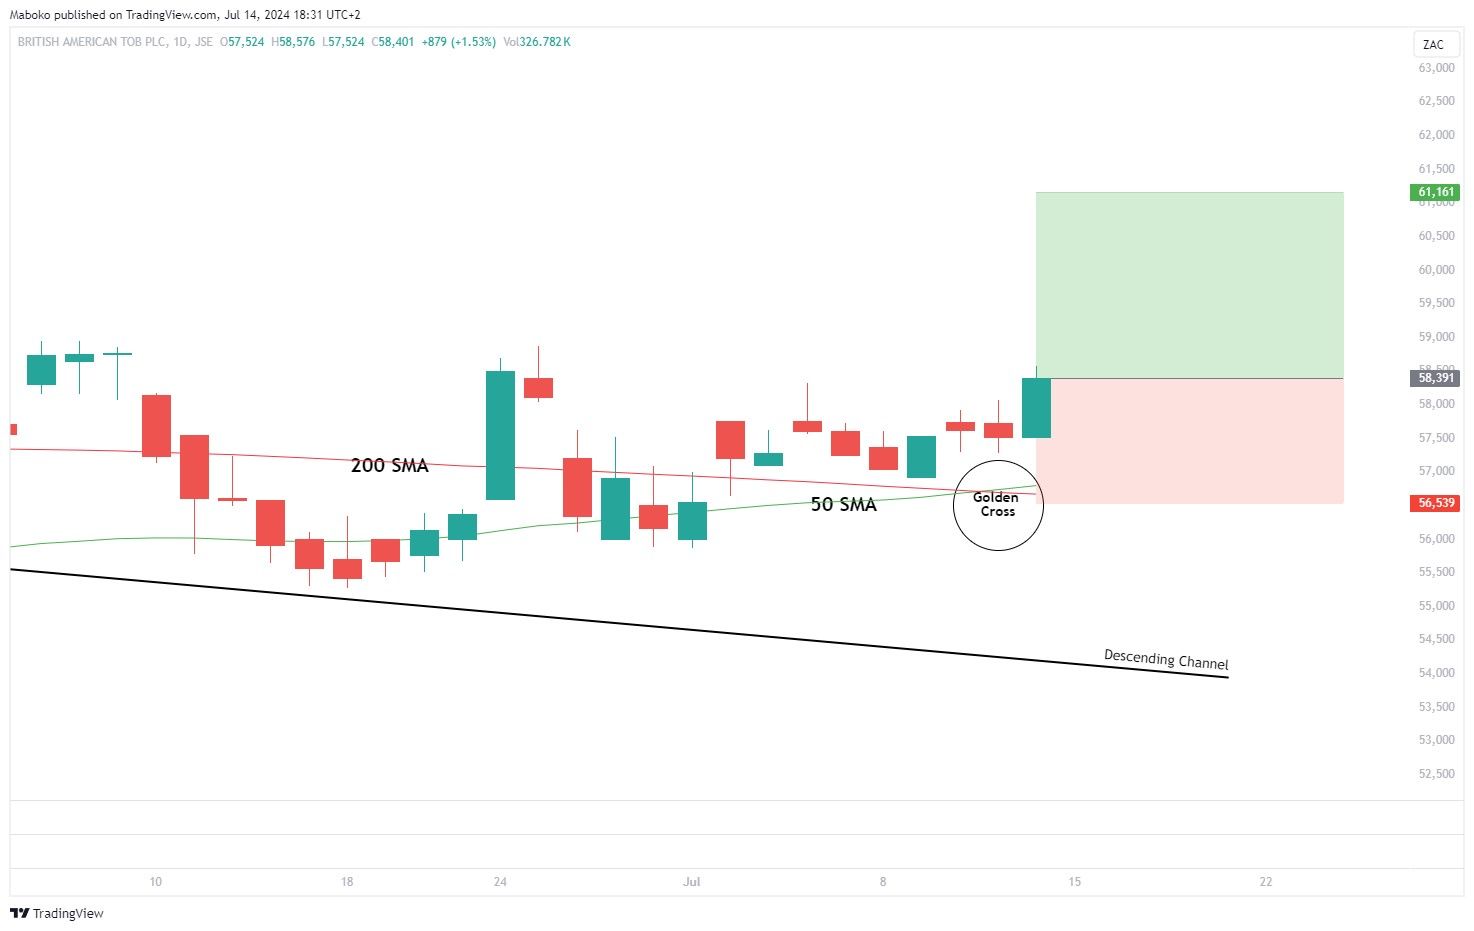
British American Tobacco plc (BTI) | Consumer Non-Durable: British American Tobacco plc is a holding company, which IS in the manufacture and distribution of tobacco products. Its brands include Kent, Dunhill, Lucky Strike and Pall Mall. It operates in the United States, Asia-Pacific and Middle East, Americas, Sub-Saharan Africa, Europe and North Africa (ENA).
In Mid May 2024, the share price broke above the long descending channel from May 2022. The Gold Cross has occurred, the 50-day Simple Moving Average (SMA) has crossed above the 200-day Simple Moving Average (SMA), signalling a change in trend.
A potential buy/long idea can be initiated with a take profit (TP) set at R611.61 and the stop loss (SL) set at R565.39.
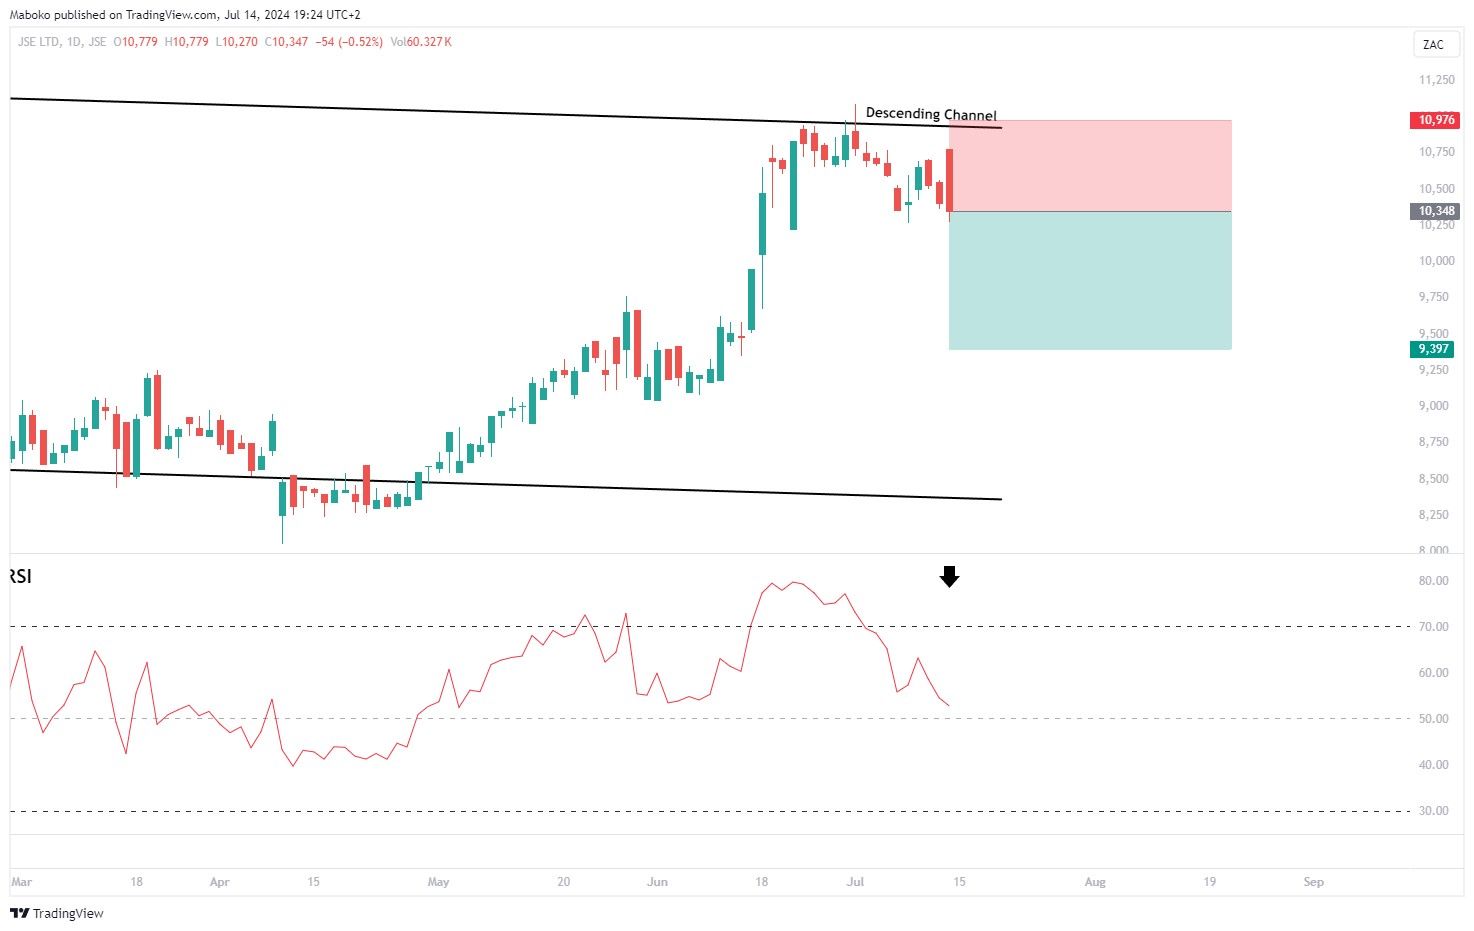
JSE Ltd (JSE) | Finance: JSE Ltd. operates as a self-regulatory,
multi-asset class stock exchange. The firm offers liquidity of tradable
products, as well as post-trade, technology, and information services. It also
provides primary market, secondary market and post-trade services.
The share price is trading in a descending channel, having tested the upper bound of the channel at the R109.00 region, the share retraced. The Relative Strength Indicator has crossed under the overbought territory, suggesting momentum to the downside is applicable.
A potential buy/long idea can be initiated with a take profit (TP) set at R60.66 and the stop loss (SL) set at R48.80.
A speculative sell/short idea can be initiated with a take profit (TP) set at R93.97 and the stop loss (SL) set at R109.76.
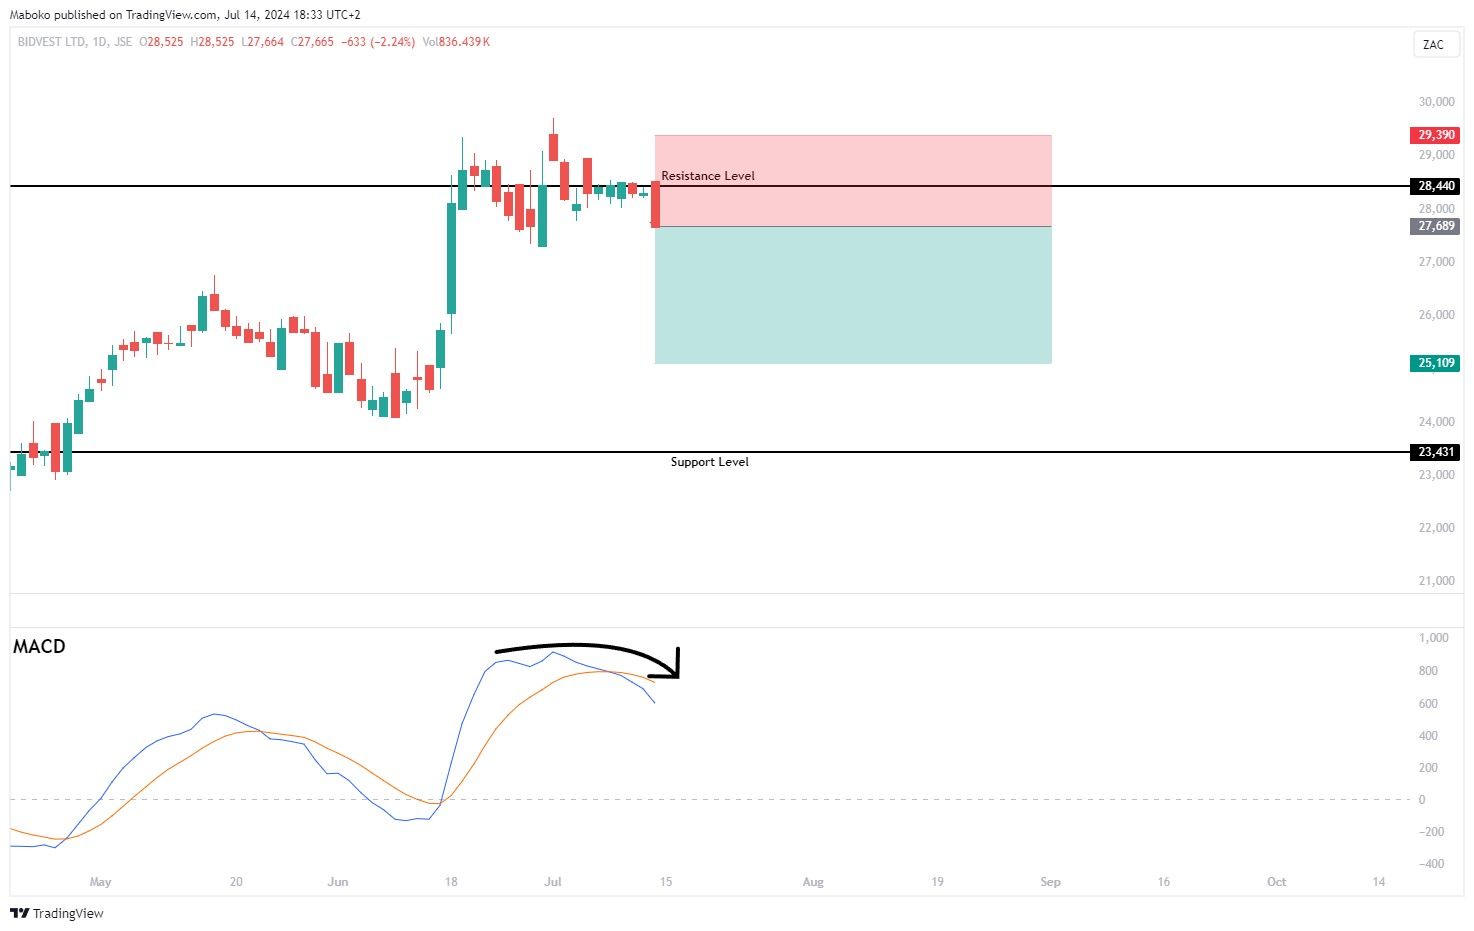
Bidvest Group Ltd (BVT) | Retail Trade: The Bidvest Group Ltd. functions as
an investment holding company with its subsidiaries operating in the services,
trading and distribution industries. It operates through automotive, commercial
products, financial services, freight, branded products and properties.
The share price has tested the record high of August 2023 (Resistance Level) at R297.00 and it started showing signs of weakens. The Moving Average Convergence Divergence (MACD) has confirmed a bearish cross under, suggesting momentum to the downside is applicable. The share has been trading in a range, the next level the price might stop is R234.31 (Support Level).
A speculative sell/short idea can be initiated with a take profit (TP) set at R251.09 and the stop loss (SL) set at R293.90.
US STOCKS
Starbucks Corp (SBUX) | Consumer Services: Starbucks Corp. is in the business of production, marketing, and retailing of specialty coffee.
The share price tested a major support the previous Thursday, also creating a double bottom pattern, signalling a reversal is imminent. The Relative strength Indicator (RSI) has made a bullish divergence, suggesting the momentum to the downside is fading and favouring upward momentum
A Buy/Long idea can be initiated with a target set at $84.25 and the stop loss set at $70.35.
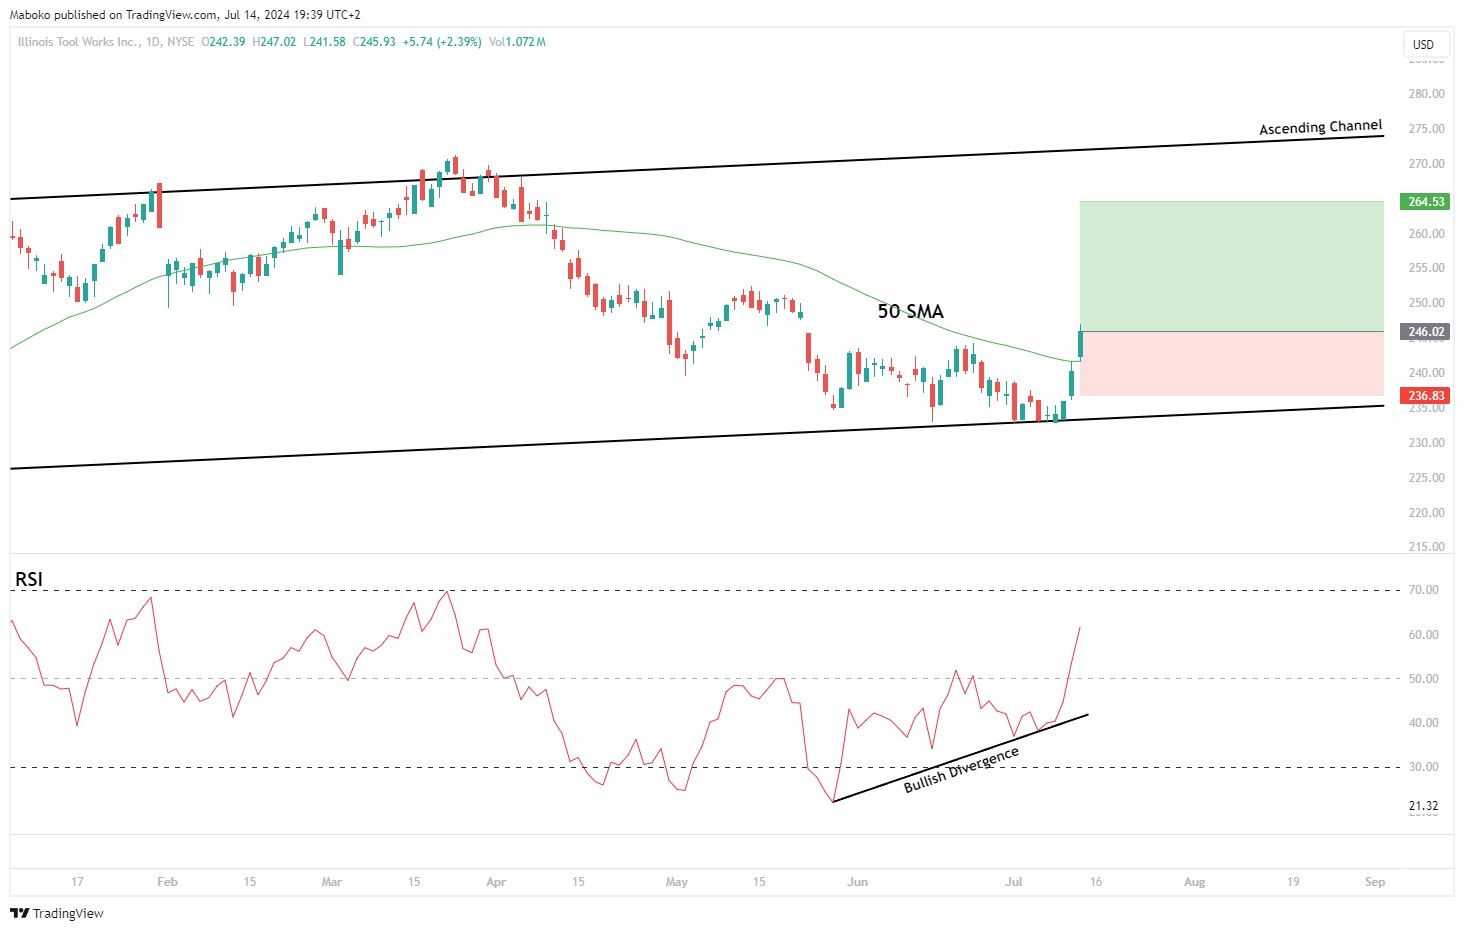
Illinois Tool Works, Inc (ITW) | Producer Manufacturing: Illinois Tool Works, Inc. is in the
business of manufacturing industrial products and equipment.
The share price is trading in an ascending channel,the price tested the lower bound of the channel. The price is trading above the 50-day Simple Moving Average (SMA), which historically has signalled price continuation in the direction of the underlying trend.The Relative Strength Indicator (RSI) has bullish divergence, suggesting momentum to the downside is fading and favouring upward momentum.
A Buy/Long idea can be initiated with a target set at $264.53 and the stop loss set at $236.83.
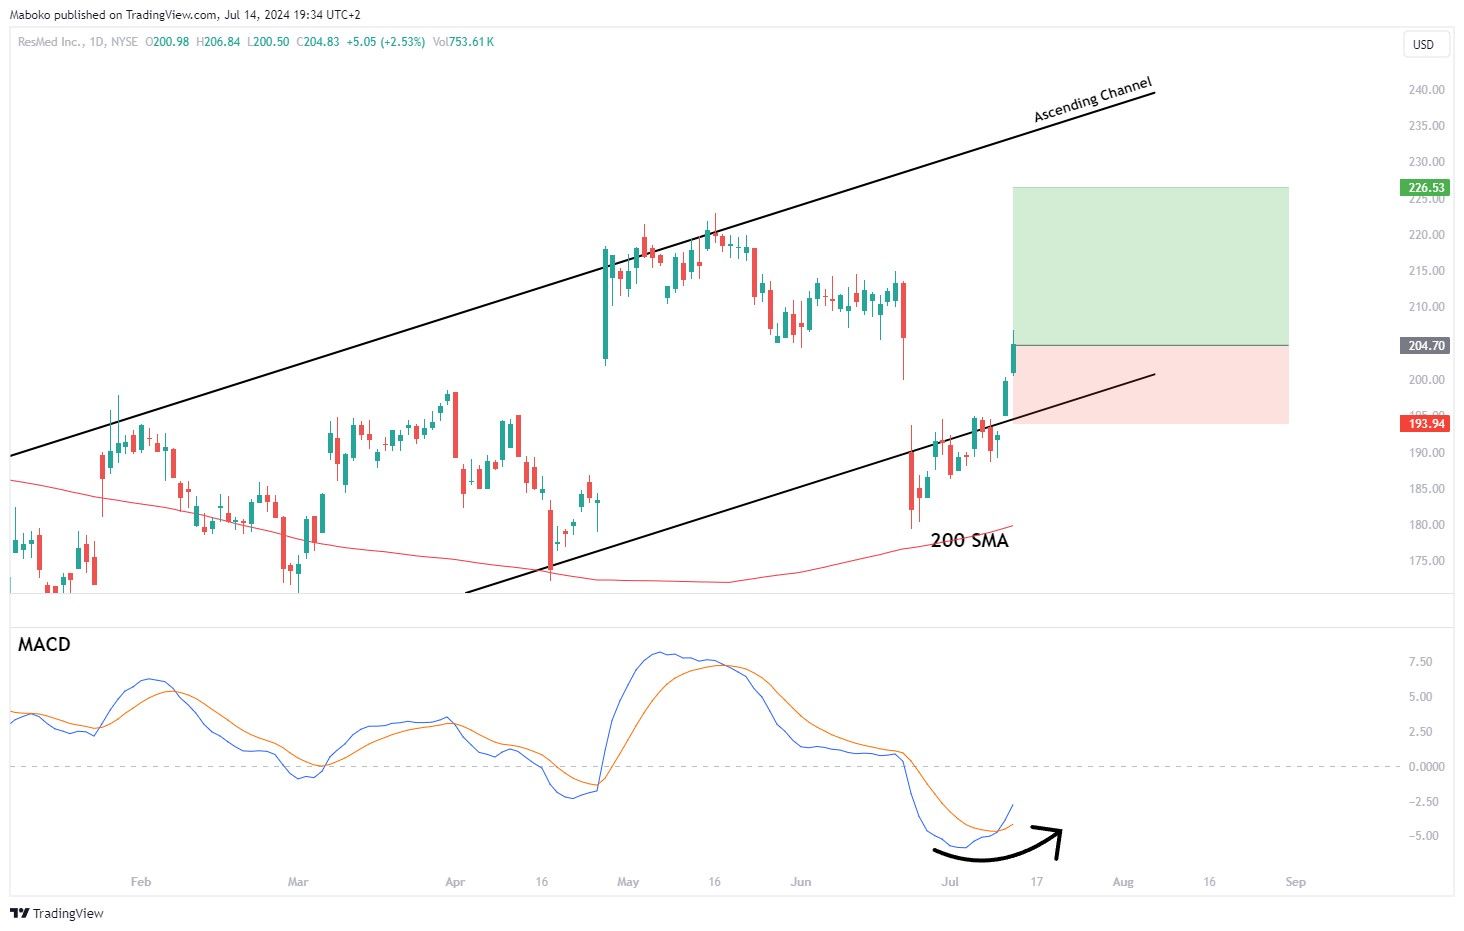
ResMed, Inc.(RMD) | Health Technology: ResMed, Inc. is in the business of providing
digital health and cloud-connected medical devices. Its digital health
technologies and cloud connected medical devices transform care for people with
sleep apnea, chronic obstructive pulmonary disease and other chronic diseases.
The share price is trading in an ascending channel, the price tested the lower bound of the channel. The price is trading above the 200-day Simple Moving Average (SMA), signalling a bullish trend. The Moving Average Convergence and Divergence (MACD) has confirmed a bullish crossover, suggesting momentum to the upside is applicable.
A Buy/Long idea can be initiated with a target set at $226.53 and the stop loss set at $193.94.
Disclaimer: Any opinions, views, analysis or other information provided in this article is provided by BCS Markets SA trading as BROKSTOCK as general market commentary and should not be viewed as advice according to the FAIS Act of 2002. BCS Markets SA does not warrant the correctness, accuracy, timeliness, reliability or completeness of any information provided by third parties. You must rely upon your judgement in all aspects of your investment decisions and all decisions are made at your own risk. BCS Markets SA and any of its employees shall not be responsible for and will not accept any liability for any direct or indirect loss including without limitation any loss of profit which may arise directly or indirectly from use of the market commentary. The content contained within the article is subject to change at any time without notice. BCS Markets SA is an authorized financial services provider FSP No. 51404.
Read also


BCS Markets SA (Pty) Ltd. is an authorized Financial Service Provider and is regulated by the South African Financial Sector Conduct Authority (FSP No.51404). BCS Markets SA Proprietary Limited trading as BROKSTOCK.
The materials on this website (the “Site”) are intended for informational purposes only. Use of and access to the Site and the information, materials, services, and other content available on or through the Site (“Content”) are subject to the laws of South Africa.
Risk notice Margin trading in financial instruments carries a high level of risk, and may not be suitable for all users. It is essential to understand that investing in financial instruments requires extensive knowledge and significant experience in the investment field, as well as an understanding of the nature and complexity of financial instruments, and the ability to determine the volume of investment and assess the associated risks. BCS Markets SA (Pty) Ltd pays attention to the fact that quotes, charts and conversion rates, prices, analytic indicators and other data presented on this website may not correspond to quotes on trading platforms and are not necessarily real-time nor accurate. The delay of the data in relation to real-time is equal to 15 minutes but is not limited. This indicates that prices may differ from actual prices in the relevant market, and are not suitable for trading purposes. Before deciding to trade the products offered by BCS Markets SA (Pty) Ltd., a user should carefully consider his objectives, financial position, needs and level of experience. The Content is for informational purposes only and it should not construe any such information or other material as legal, tax, investment, financial, or other advice. BCS Markets SA (Pty) Ltd will not accept any liability for loss or damage as a result of reliance on the information contained within this Site including data, quotes, conversion rates, etc.
Third party content BCS Markets SA (Pty) Ltd. may provide materials produced by third parties or links to other websites. Such materials and websites are provided by third parties and are not under BCS Markets SA (Pty) Ltd.'s direct control. In exchange for using the Site, the user agrees not to hold BCS Markets SA (Pty) Ltd., its affiliates or any third party service provider liable for any possible claim for damages arising from any decision user makes based on information or other Content made available to the user through the Site.
Limitation of liability The user’s exclusive remedy for dissatisfaction with the Site and Content is to discontinue using the Site and Content. BCS Markets SA (Pty) Ltd. is not liable for any direct, indirect, incidental, consequential, special or punitive damages. Working with BCS Markets SA you are trading share CFDs. When trading CFDs on shares you do not own the underlying asset. Share CFDs are complex instruments and come with a high risk of losing money rapidly due to leverage. A high percentage of retail traders accounts lose money when trading CFDs with their provider. All rights reserved. Any use of Site materials without permission is prohibited.