JSE & NYSE Shares Analysis | 2-5 April

JSE SHARES
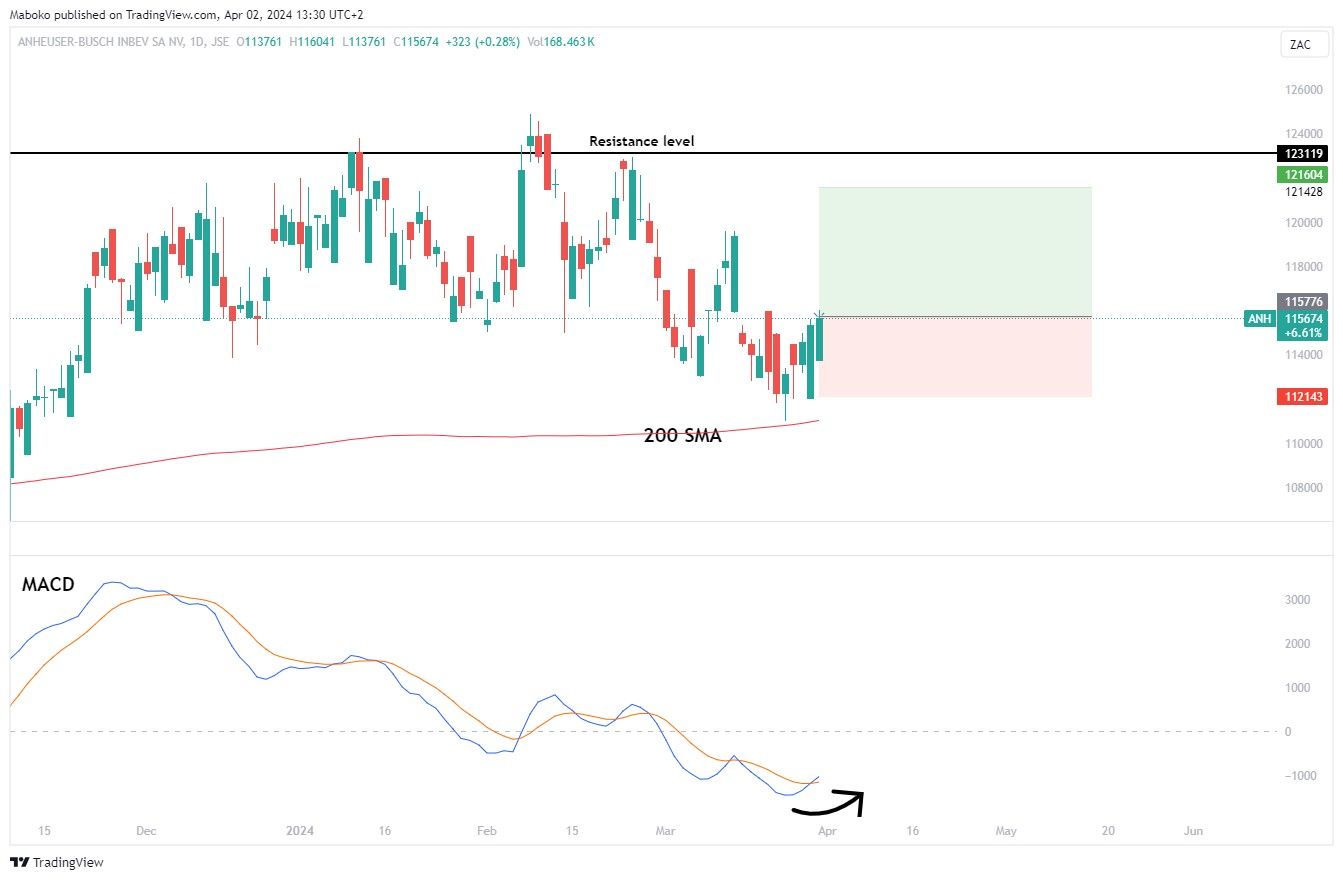
• Anheuser-Busch InBev SA/NV (ANH) | Consumer Non-Durables: AB InBev operates as a holding company, which is in the manufacturing and distribution of alcoholic and non-alcoholic beverages. It operates in North America, Americas, South America, Asia Pacific and global exports.
The share price is currently trading at R1157.76. The share has been making higher highs and lower highs. The MACD has made a bullish crossover. The share is trading above the 200 SMA, suggesting the bulls are in charge.
A buy/long idea can be initiated with a take profit (TP) set at R1216.04 and the stop loss (SL) set at R1121.43.
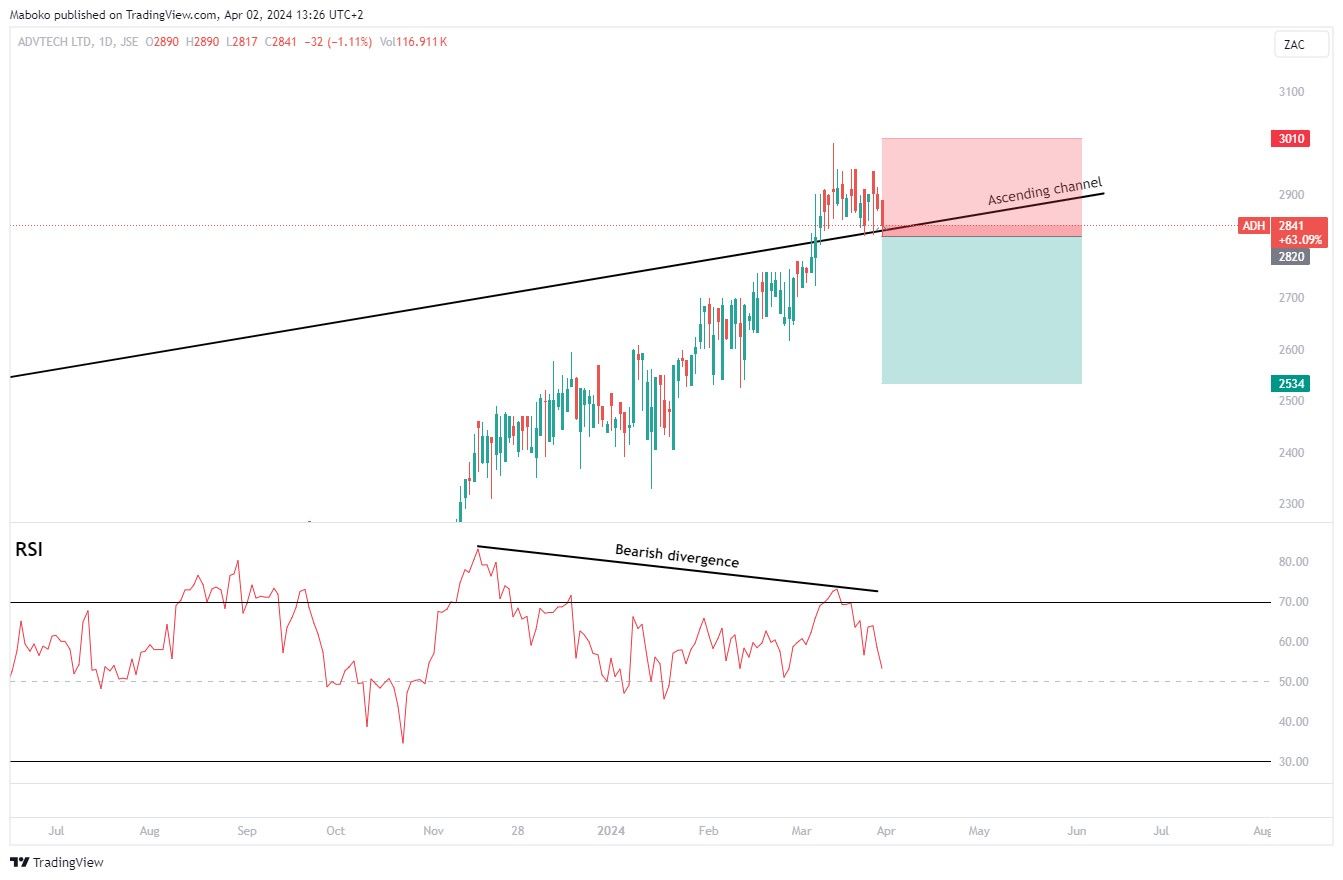
• ADvTECH
Ltd (ADH) | Commercial Services: ADvTECH Ltd. is in the business of education,
training, skills development, and career placement services. It operates
through schools, tertiary and resourcing.
The share price is currently trading at R28.41. The share is in an ascending channel, having tested the top of the channel. The price has made a false breakout above the channel. The RSI has been in a bearish divergence as the share price soars,suggesting momentum to the upside is fading.
A sell/short can be initiated with a take profit (TP) set at R25.34 and stop loss (SL) set at R30.10.
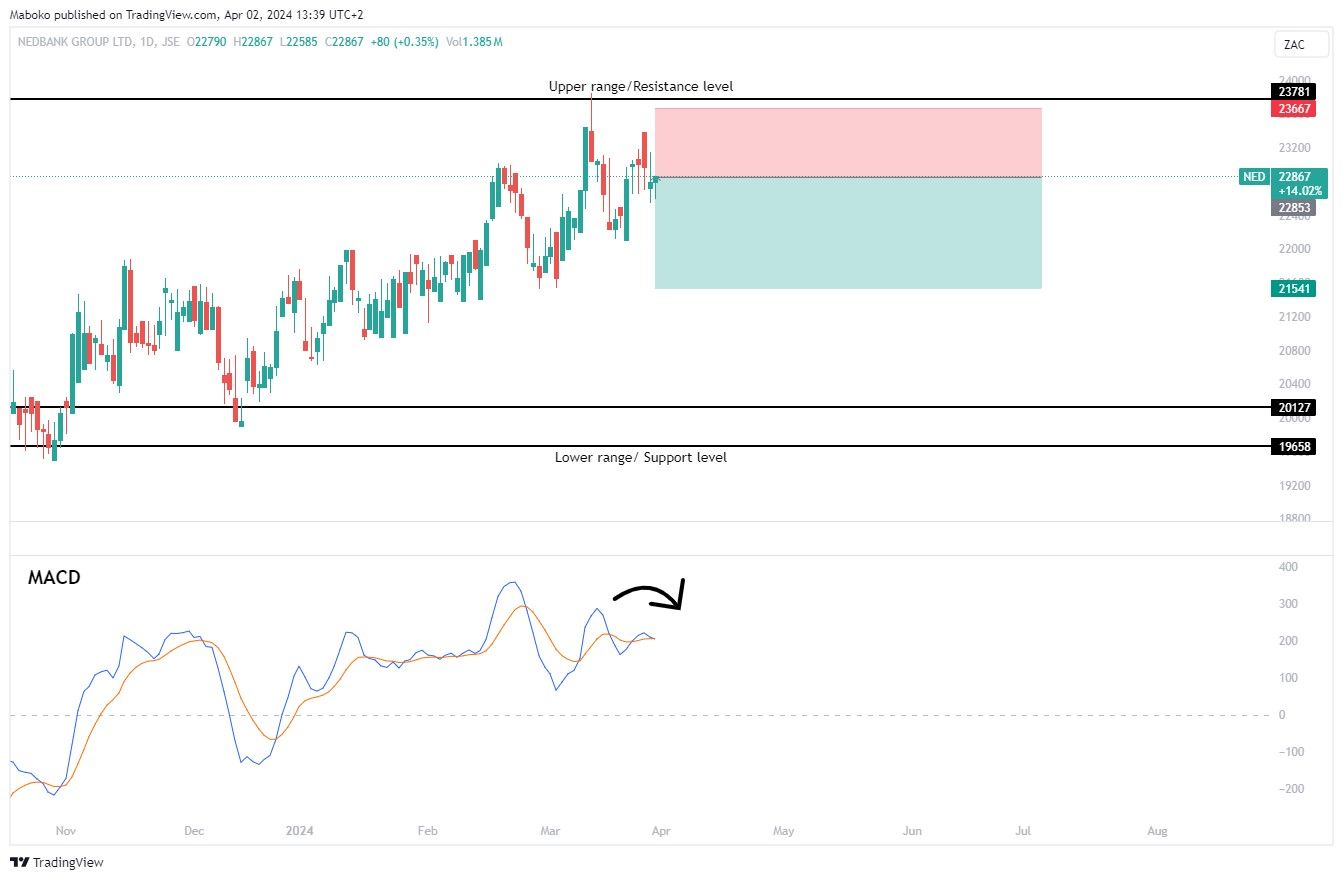
• Nedbank
Group Ltd (NED) | Finance: Nedbank Group Ltd. is one of the leading
financial services providers in South Africa. It offers banking, insurance and
asset management. It has operations in seven African countries.
The share price has been in a range since February 2022, the high of the range is in the region of R237.00 and the low of the range is in the region of R195.00. The price is currently trading at R228.67 from the top of the range. The MACD has a bearish crossunder.
A sell/short can be initiated with a take profit (TP) set at R215.41 and stop loss (SL) set at R236.67.
US STOCKS
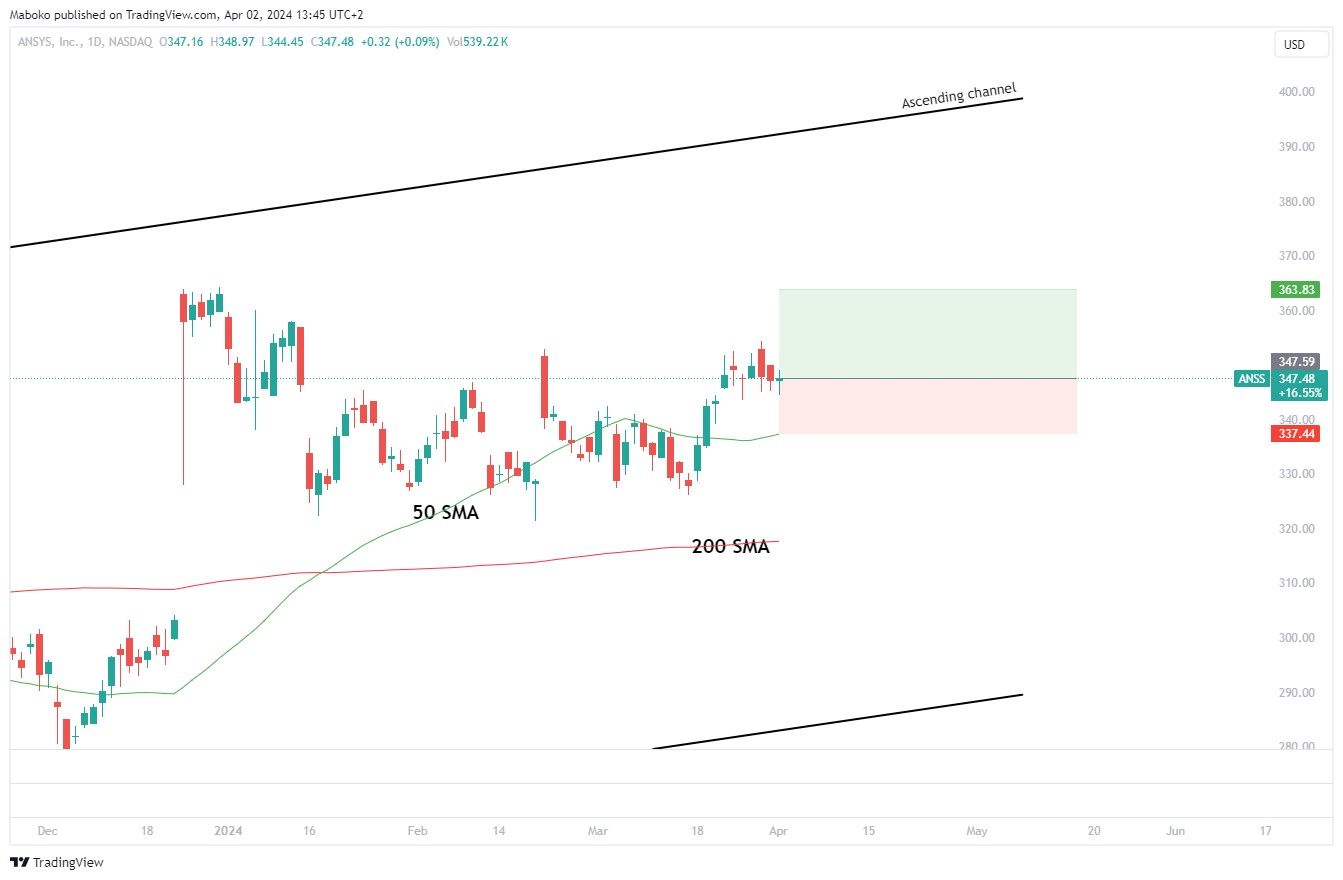
• ANSYS, Inc (ANSS) | Technology Services: ANSYS, Inc. is in the business of development and marketing of engineering simulation software and services. The firm's solutions include industries such as automotive, aerospace, defence, construction, energy, materials and chemical processing..
The share price has been in an ascending channel, it is yet to test the upper channel line. The 50-day SMA is above the 200-day SMA and the share price is trading above both the moving averages, suggesting that the bulls are in charge of the trend.
A buy/long idea can be initiated with a take profit (TP) set at $363.83 and the stop loss (SL) set at $337.44.
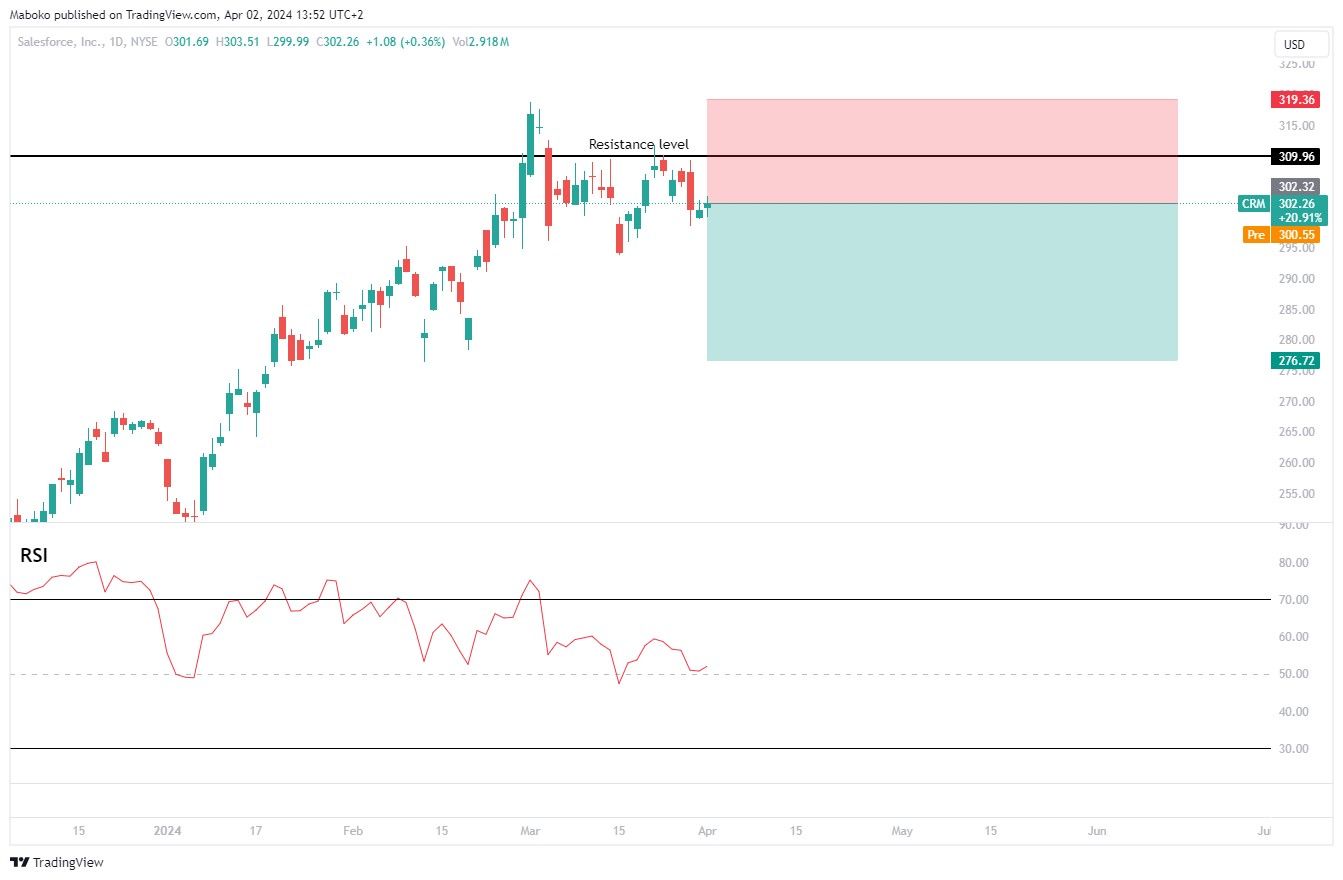
• Salesforce,
Inc (CRM) | Technology Services: Salesforce, Inc. is in the business of design
and development of cloud-based enterprise software for customer relationship management.
Its solutions include sales force automation, customer service and support,
marketing automation, digital commerce, community management, collaboration,
industry-specific solutions, and salesforce platform.
The share price is currently trading at $302.26. The share price has tested the major resistance level at $309.96 and has since traded below. The RSI was in oversold territory when it tested the resistance level.
A sell/short can be initiated with a take profit (TP) set at $319.36 and stop loss (SL) set at $276.72.
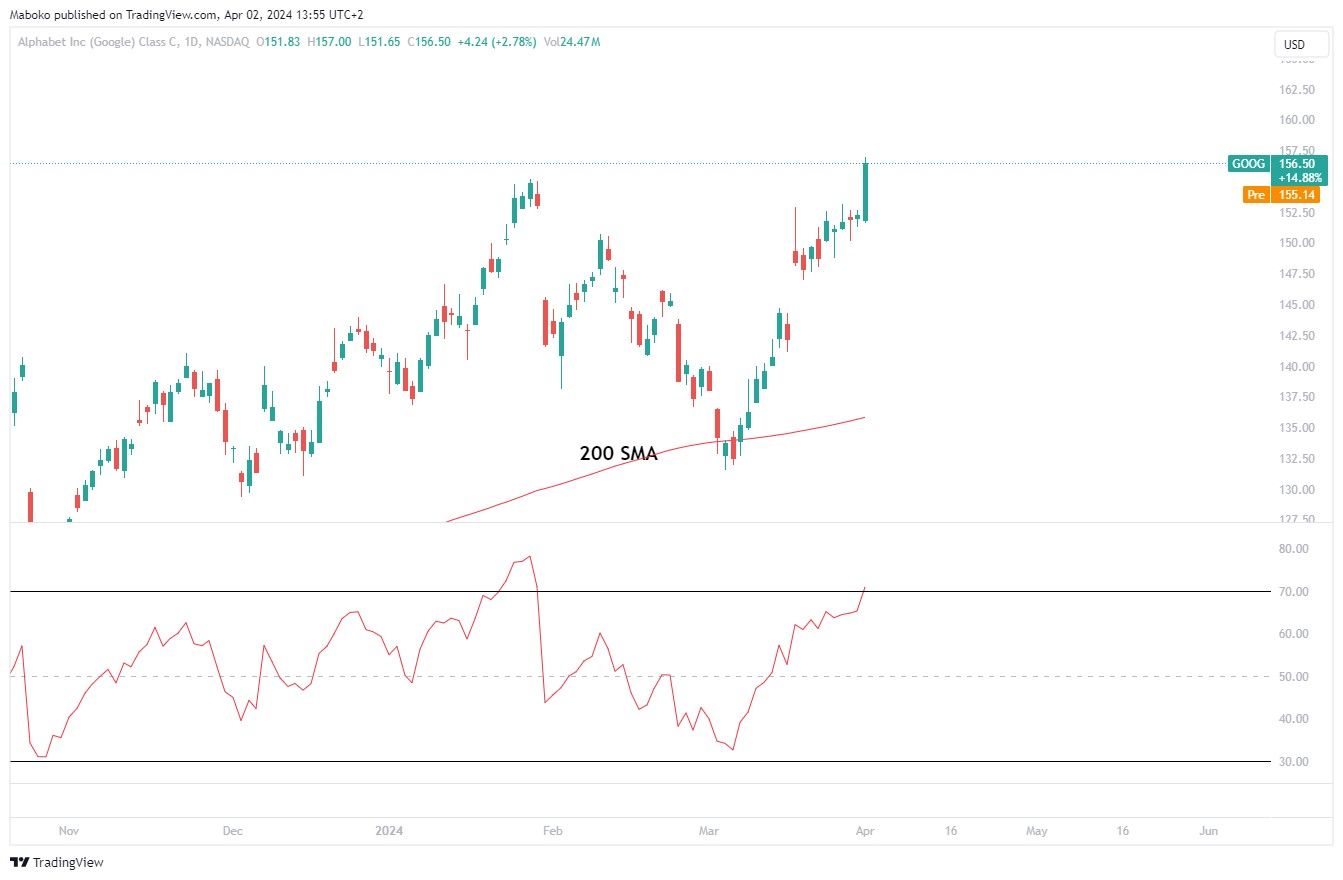
• Alphabet Inc (GOOG) | Technology Services: Alphabet, Inc. is a holding company, which is in the
business of software, health care, transportation, and other technologies. It
operates through Google Service and Google Cloud.
The share price has made a record high of $155.74 after making a 3.02% move on Monday. The RSI is in overbought territory, suggesting momentum could slow down. The share could make a retracement back to the $153.00 level before making its way up.
Disclaimer:
Any opinions,
views, analysis or other information provided in this article is provided by
BCS Markets SA trading as BROCKSTOCK as general market commentary and should
not be viewed as advice according to the FAIS Act of 2002. BCS Markets SA does
not warrant the correctness, accuracy, timeliness, reliability or completeness
of any information provided by third parties. You must rely upon your judgement
in all aspects of your investment decisions and all decisions are made at your
own risk. BCS Markets SA and any of its employees shall not be responsible for
and will not accept any liability for any direct or indirect loss including
without limitation any loss of profit which may arise directly or indirectly
from use of the market commentary. The content contained within the article is
subject to change at any time without notice. BCS Markets SA is an authorized
financial services provider FSP No. 51404.


BCS Markets SA (Pty) Ltd. is an authorized Financial Service Provider and is regulated by the South African Financial Sector Conduct Authority (FSP No.51404). BCS Markets SA Proprietary Limited trading as BROKSTOCK.
The materials on this website (the “Site”) are intended for informational purposes only. Use of and access to the Site and the information, materials, services, and other content available on or through the Site (“Content”) are subject to the laws of South Africa.
Risk notice Margin trading in financial instruments carries a high level of risk, and may not be suitable for all users. It is essential to understand that investing in financial instruments requires extensive knowledge and significant experience in the investment field, as well as an understanding of the nature and complexity of financial instruments, and the ability to determine the volume of investment and assess the associated risks. BCS Markets SA (Pty) Ltd pays attention to the fact that quotes, charts and conversion rates, prices, analytic indicators and other data presented on this website may not correspond to quotes on trading platforms and are not necessarily real-time nor accurate. The delay of the data in relation to real-time is equal to 15 minutes but is not limited. This indicates that prices may differ from actual prices in the relevant market, and are not suitable for trading purposes. Before deciding to trade the products offered by BCS Markets SA (Pty) Ltd., a user should carefully consider his objectives, financial position, needs and level of experience. The Content is for informational purposes only and it should not construe any such information or other material as legal, tax, investment, financial, or other advice. BCS Markets SA (Pty) Ltd will not accept any liability for loss or damage as a result of reliance on the information contained within this Site including data, quotes, conversion rates, etc.
Third party content BCS Markets SA (Pty) Ltd. may provide materials produced by third parties or links to other websites. Such materials and websites are provided by third parties and are not under BCS Markets SA (Pty) Ltd.'s direct control. In exchange for using the Site, the user agrees not to hold BCS Markets SA (Pty) Ltd., its affiliates or any third party service provider liable for any possible claim for damages arising from any decision user makes based on information or other Content made available to the user through the Site.
Limitation of liability The user’s exclusive remedy for dissatisfaction with the Site and Content is to discontinue using the Site and Content. BCS Markets SA (Pty) Ltd. is not liable for any direct, indirect, incidental, consequential, special or punitive damages. Working with BCS Markets SA you are trading share CFDs. When trading CFDs on shares you do not own the underlying asset. Share CFDs are complex instruments and come with a high risk of losing money rapidly due to leverage. A high percentage of retail traders accounts lose money when trading CFDs with their provider. All rights reserved. Any use of Site materials without permission is prohibited.