JSE & NYSE Shares Analysis | 2-6 September

JSE SHARES
Mining
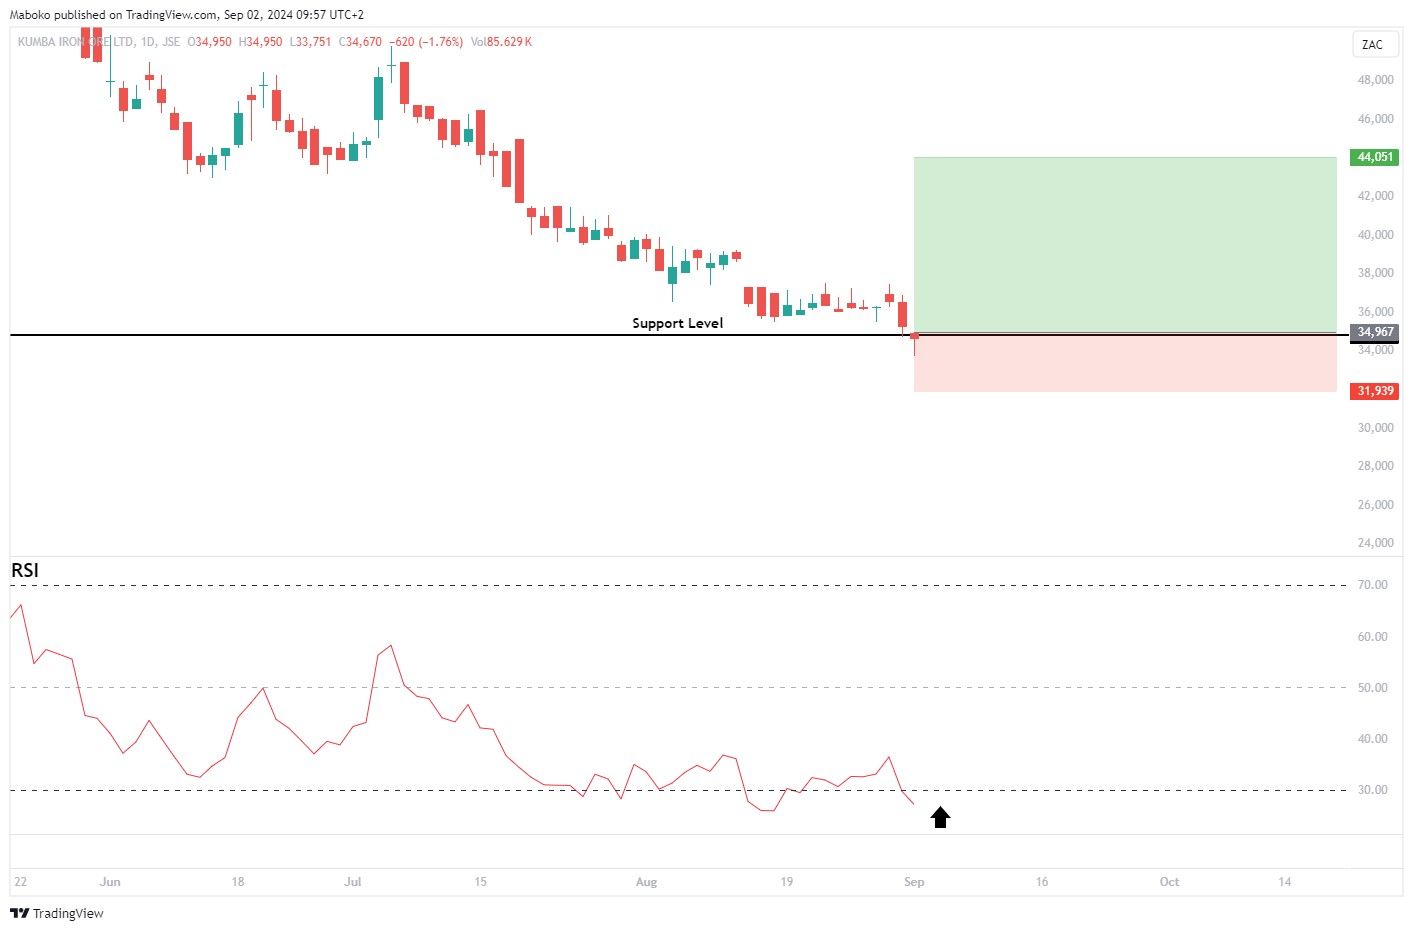
Kumba Iron Ore Ltd. (KIO): Kumba Iron Ore Ltd. is in the business of extracting, producing, and selling iron ore.
The share price is currently trading at the lows of September 2022 at R349.67 which is the support level. The relative strength indicator (RSI) is in overbought territory, suggesting a break from downward momentum, making upward momentum imminent.
A potential Buy/Long idea can be initiated with a take profit (TP) set at R440.51 and the stop loss (SL) set at R319.39.
Process Industries
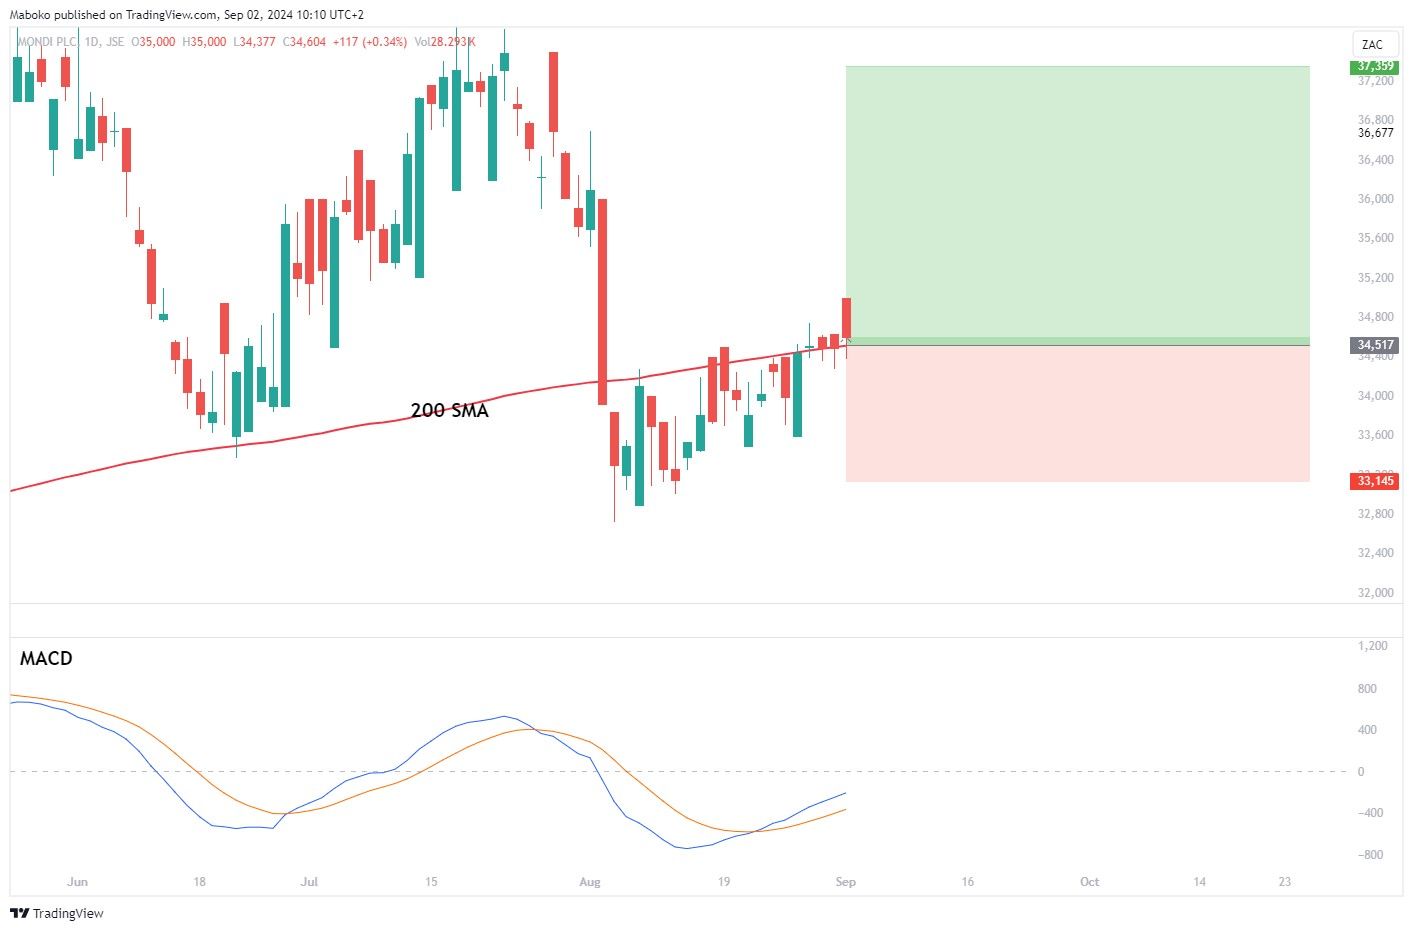
Mondi Plc (MNP): Mondi Plc is a holding company which manufactures and distributes packaging and paper products. It operates through the following packaging: corrugated packaging, flexible packaging and uncoated fine paper.
The share price has tested the 200-day simple moving average (SMA) and has historically been a dynamic support/resistance level. The moving average divergence convergence (MACD) has signalled a bullish crossover, suggesting momentum to the upside.
A speculative Sell/Short idea can be initiated with a take profit (TP) set at R373.59 and the stop loss (SL) set at R331.45.
Finance
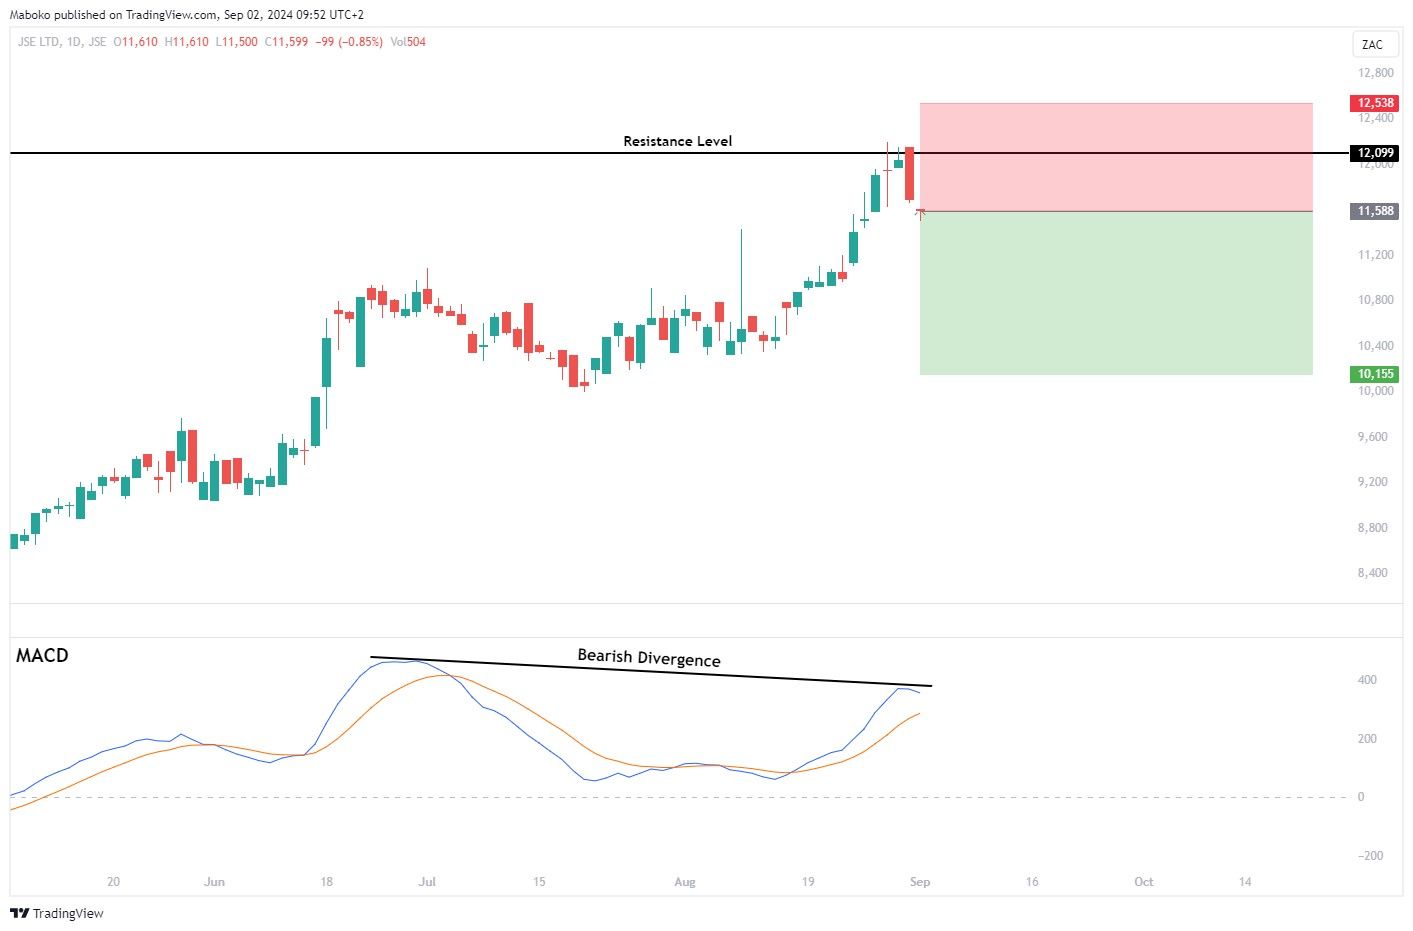
JSE Ltd. (JSE): JSE Ltd. operates as a self-regulatory, multi-asset class stock exchange. The firm offers liquidity for tradable products, as well as post-trade, technology, and information services. It also provides primary market, secondary market and post-trade services.
The share price has tested the resistance level at R120.99 and has since retraced. As confluence, the moving average convergence divergence (MACD) has a bearish divergence unfolding, signalling that the upward momentum is fading and favouring downward momentum.
A speculative Sell/Short idea can be initiated with a take profit (TP) set at R101.55 and the stop loss (SL) set at R125.38.
US STOCKS
Information Technology
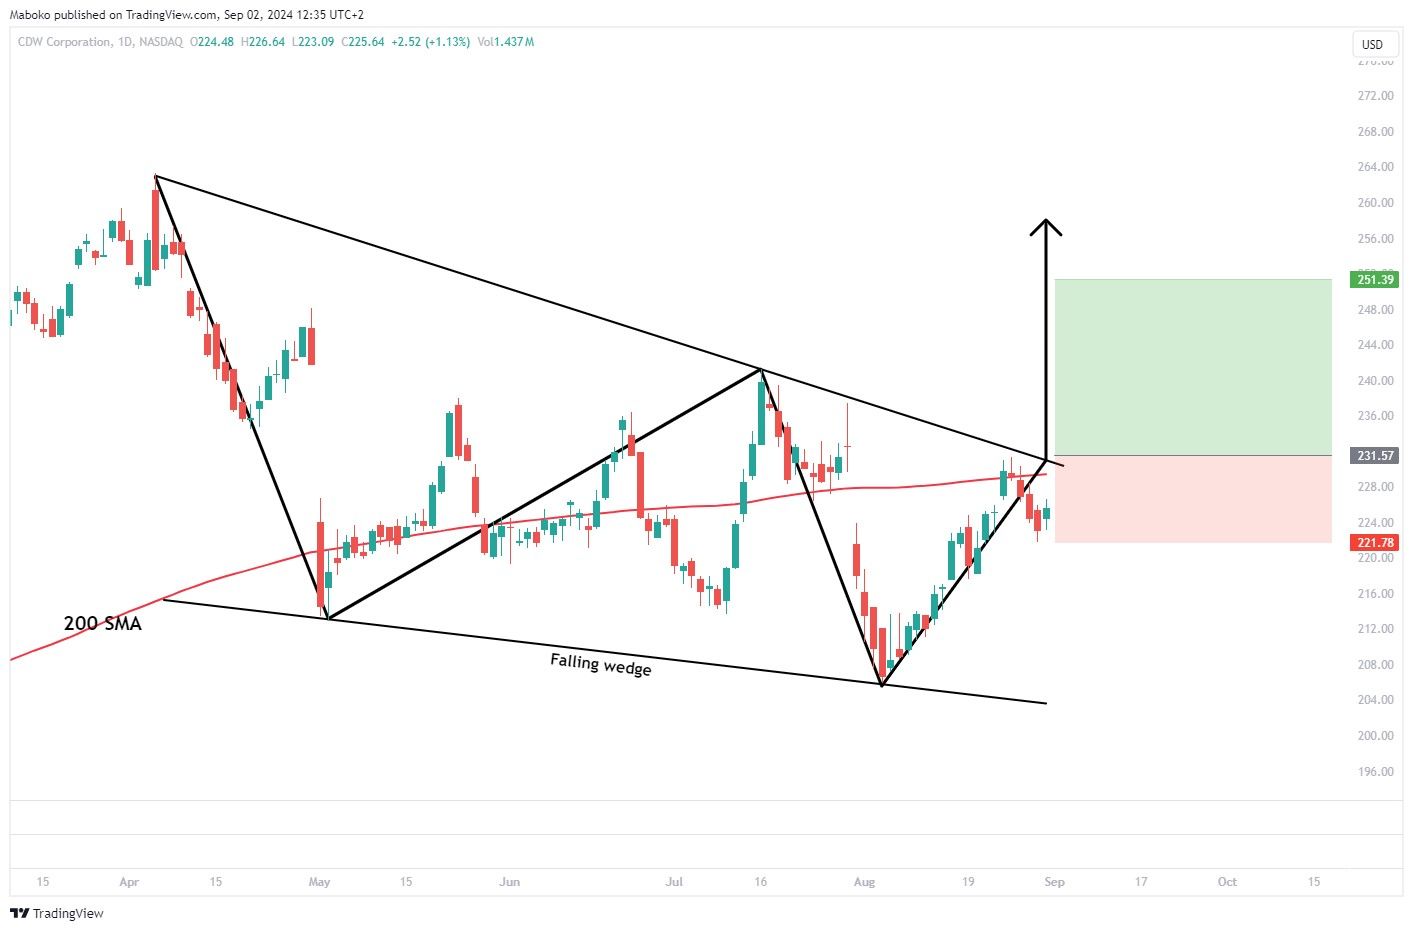
CDW Corp. (CDW): CDW Corp. is in the business of information technology solutions to businesses, government, education, and healthcare customers.
A falling wedge has formed and a bullish continuation is yet to be confirmed, indicating a potential upward price movement. The share price has been trading below the 200-day simple moving average (SMA), suggesting the bears are in charge of the trend. A close above the falling wedge pattern and the 200-day SMA will confirm the direction of the share price.
A speculative Buy/Long can be initiated once the two conditions are met with a take profit (TP) set at $251.39 and the stop loss (SL) set at $221.78.
Industrials
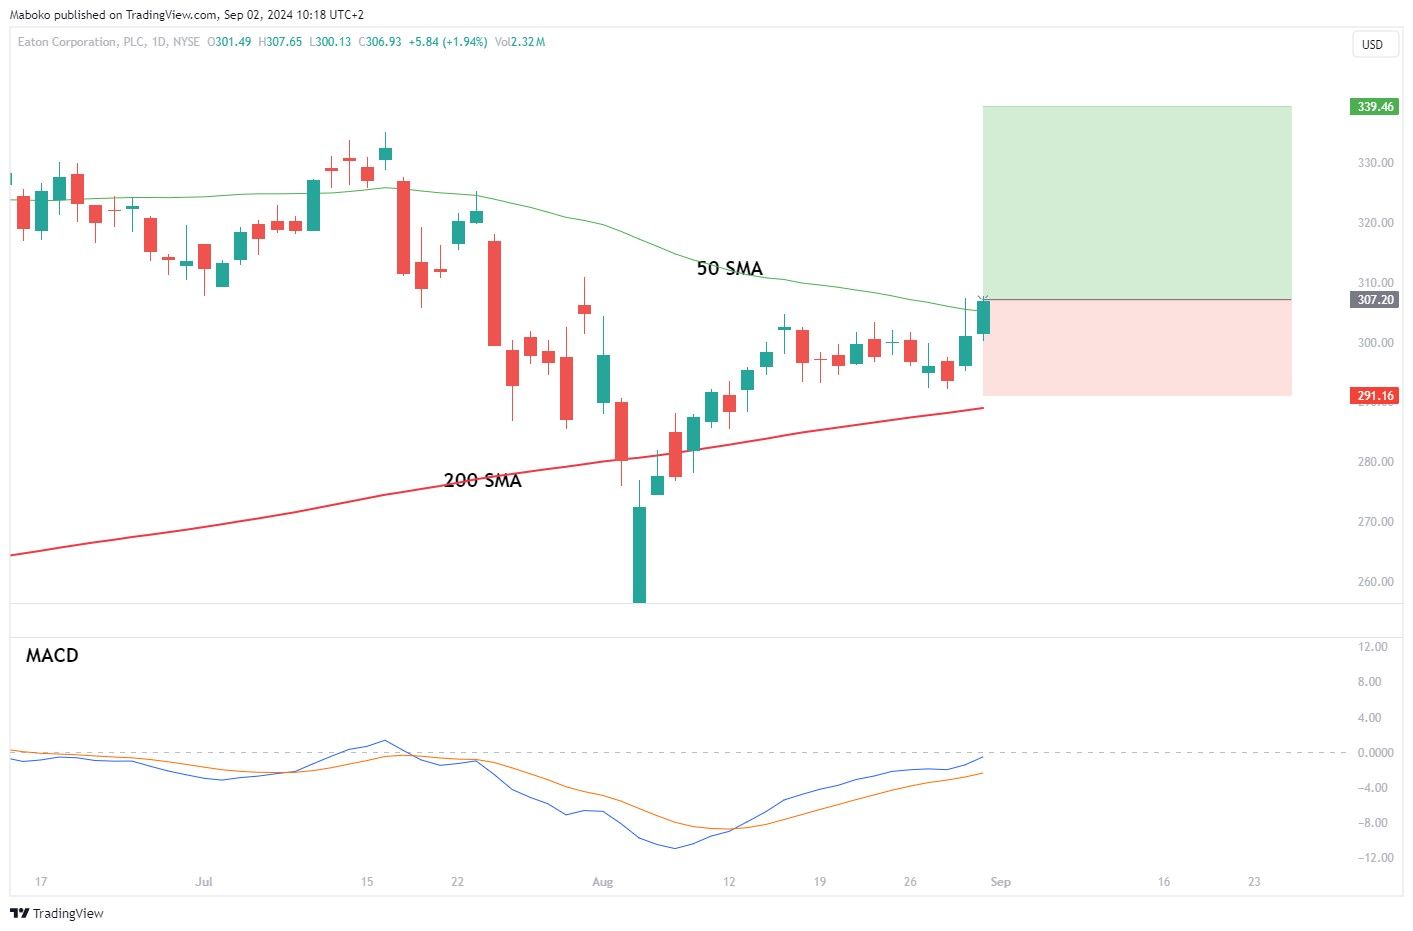
Eaton Corp. Plc. (ETN): Eaton Corp. Plc is a power management company, which provides energy-efficient solutions for electrical, hydraulic and mechanical power.
The share price has retraced to test the 200-day simple moving average (SMA). On Friday, the share price closed above the 50 SMA, suggesting trend continuation to the upside. Momentum is in an upward direction.
A speculative Buy/Long can be initiated, with a take profit (TP) set at $339.46 and the stop loss (SL) set at $291.16.
Information Technology
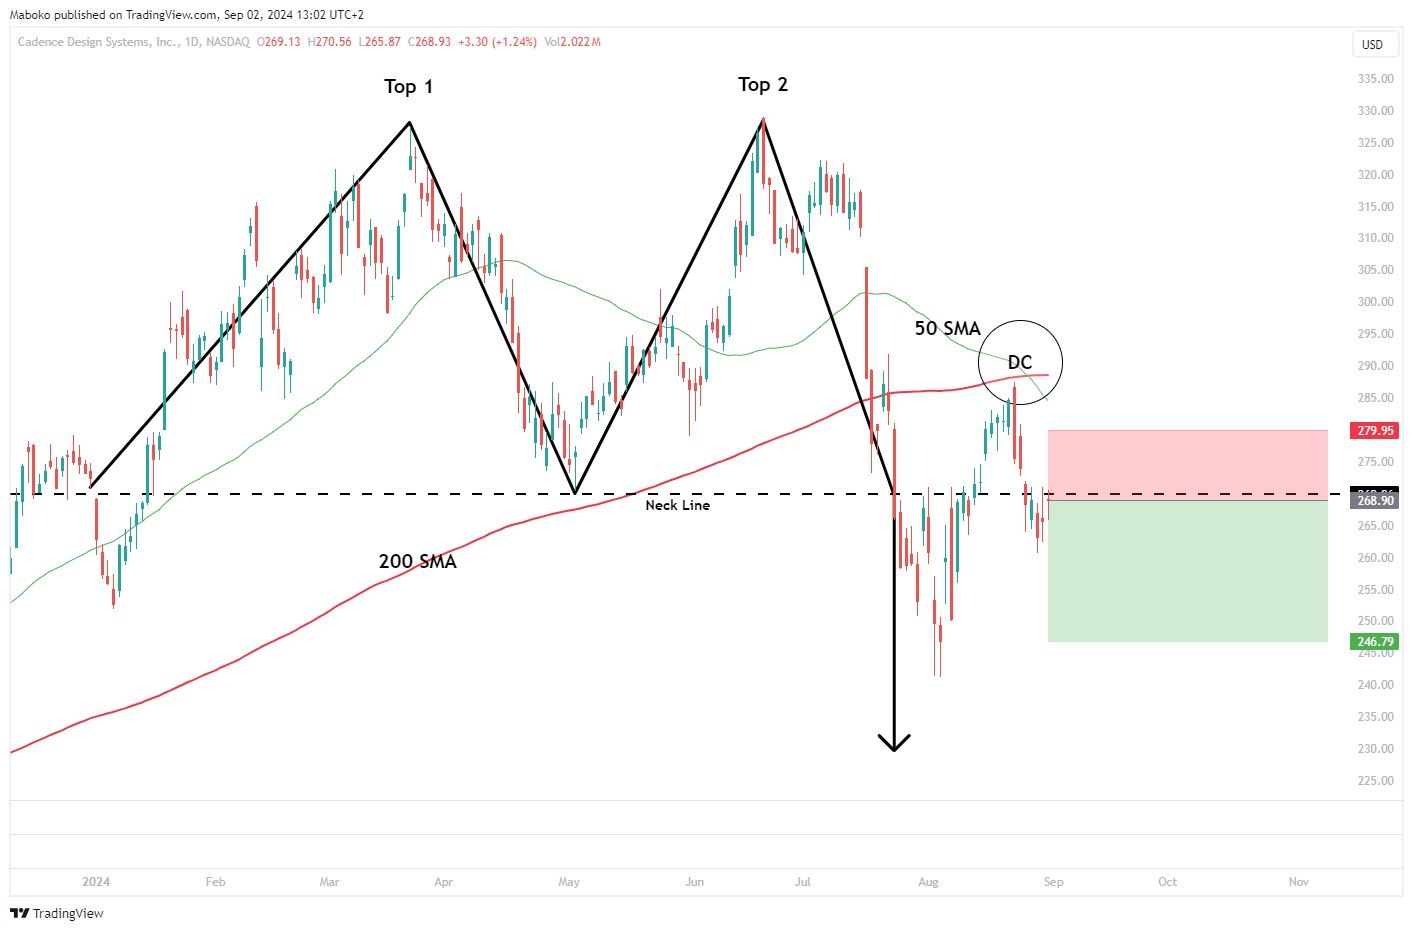
Cadence Design Systems, Inc. (CDNS): Cadence Design Systems, Inc. is in the design and development of integrated circuits and electronic devices.
A double top pattern has unfolded with the peaks in the $327 region, and the share price has closed below the neck line at $268.96, suggesting there is a trend reversal. As confluence, the 50-day simple moving average (SMA) has crossed under the 200-day SMA, signalling the death cross (DC).
A speculative sell/short idea can be initiated with a take profit (TP) set at $246.79 and the stop loss (SL) set at $279.95.
Disclaimer: Any opinions, views, analysis or other information provided in this article is provided by BCS Markets SA trading as BROCKSTOCK as general market commentary and should not be viewed as advice according to the FAIS Act of 2002. BCS Markets SA does not warrant the correctness, accuracy, timeliness, reliability or completeness of any information provided by third parties. You must rely upon your judgement in all aspects of your investment decisions and all decisions are made at your own risk. BCS Markets SA and any of its employees shall not be responsible for and will not accept any liability for any direct or indirect loss including without limitation any loss of profit which may arise directly or indirectly from use of the market commentary. The content contained within the article is subject to change at any time without notice. BCS Markets SA is an authorized financial services provider FSP No. 51404.


BCS Markets SA (Pty) Ltd. is an authorized Financial Service Provider and is regulated by the South African Financial Sector Conduct Authority (FSP No.51404). BCS Markets SA Proprietary Limited trading as BROKSTOCK.
The materials on this website (the “Site”) are intended for informational purposes only. Use of and access to the Site and the information, materials, services, and other content available on or through the Site (“Content”) are subject to the laws of South Africa.
Risk notice Margin trading in financial instruments carries a high level of risk, and may not be suitable for all users. It is essential to understand that investing in financial instruments requires extensive knowledge and significant experience in the investment field, as well as an understanding of the nature and complexity of financial instruments, and the ability to determine the volume of investment and assess the associated risks. BCS Markets SA (Pty) Ltd pays attention to the fact that quotes, charts and conversion rates, prices, analytic indicators and other data presented on this website may not correspond to quotes on trading platforms and are not necessarily real-time nor accurate. The delay of the data in relation to real-time is equal to 15 minutes but is not limited. This indicates that prices may differ from actual prices in the relevant market, and are not suitable for trading purposes. Before deciding to trade the products offered by BCS Markets SA (Pty) Ltd., a user should carefully consider his objectives, financial position, needs and level of experience. The Content is for informational purposes only and it should not construe any such information or other material as legal, tax, investment, financial, or other advice. BCS Markets SA (Pty) Ltd will not accept any liability for loss or damage as a result of reliance on the information contained within this Site including data, quotes, conversion rates, etc.
Third party content BCS Markets SA (Pty) Ltd. may provide materials produced by third parties or links to other websites. Such materials and websites are provided by third parties and are not under BCS Markets SA (Pty) Ltd.'s direct control. In exchange for using the Site, the user agrees not to hold BCS Markets SA (Pty) Ltd., its affiliates or any third party service provider liable for any possible claim for damages arising from any decision user makes based on information or other Content made available to the user through the Site.
Limitation of liability The user’s exclusive remedy for dissatisfaction with the Site and Content is to discontinue using the Site and Content. BCS Markets SA (Pty) Ltd. is not liable for any direct, indirect, incidental, consequential, special or punitive damages. Working with BCS Markets SA you are trading share CFDs. When trading CFDs on shares you do not own the underlying asset. Share CFDs are complex instruments and come with a high risk of losing money rapidly due to leverage. A high percentage of retail traders accounts lose money when trading CFDs with their provider. All rights reserved. Any use of Site materials without permission is prohibited.