Get started

Basic Materials
Thungela Resources Ltd. (TGA): Thungela Resources Ltd. is in the production and marketing of thermal coal reserves. It operates in South Africa and Australia.
The share price broke out of a falling wedge pattern, triggering a potential upside. As confluence, the price closed above the 200-day simple moving average (SMA) on Friday, signalling that the bulls are in charge of the trend direction.
A potential Buy/Long idea can be initiated with the take profit (TP) set at R139.91 and the stop loss (SL) set at R116.95.
Telecommunications
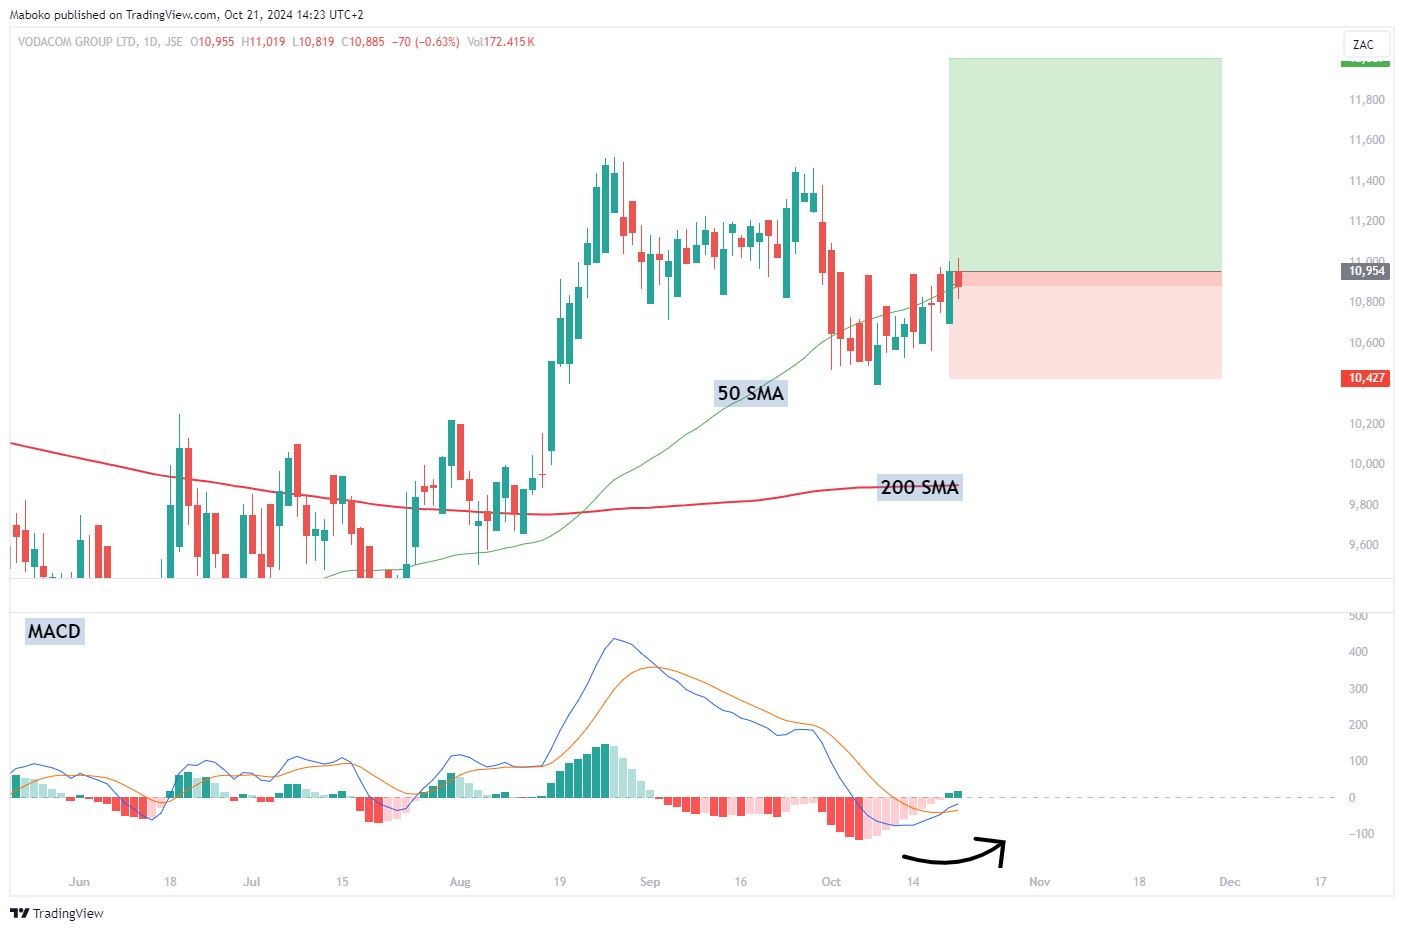
Vodacom Group Ltd. (VOD): The Vodacom Group Ltd. is in the communications products and services business. It offers cellular networks in South Africa, Tanzania, Mozambique, Lesotho and the Democratic Republic of Congo.
The share price tested the 50-day SMA, signalling a potential trend continuation. The price is trading above the 200-day SMA, signalling the bulls are in charge of the trend direction. The moving average convergence divergence (MACD) has signalled a bullish crossover, suggesting momentum to the upside is possible.
A potential Buy/Long can be initiated with the TP set at R120.07 and the SL set at R104.27.
Financials
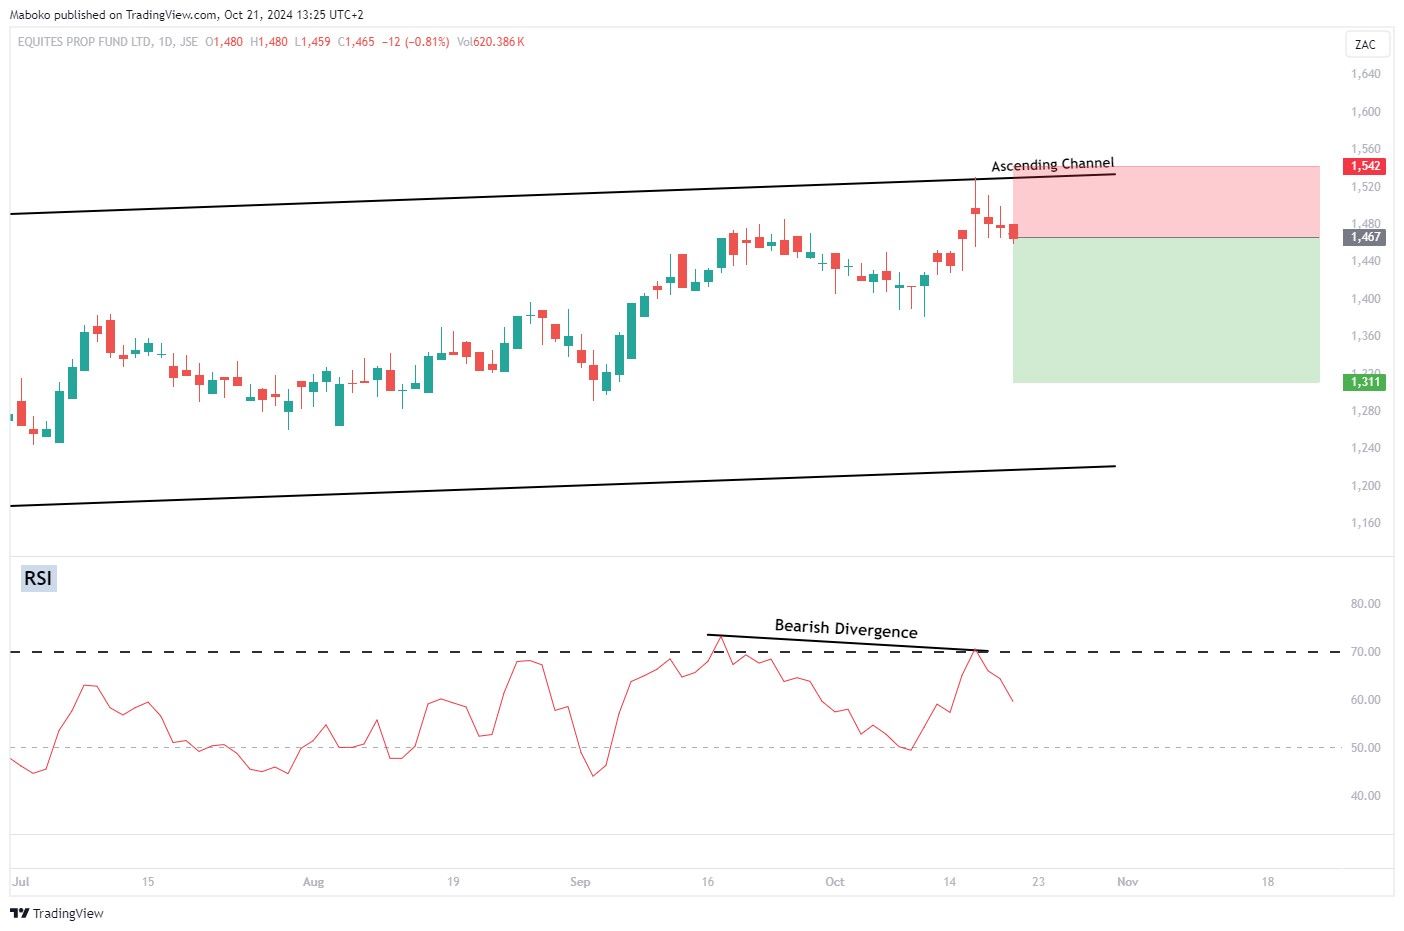
Equites Property Fund Ltd (EQU): Equites Property Fund Ltd. manages logistics properties. It operates through the industrial United Kingdom and South Africa.
The share price has been trading in a descending channel. On Wednesday, it tested the upper bounds of the channel at the R15.30 region. The relative strength indicator (RSI) has signalled a bearish divergence, suggesting momentum to the upside is fading and signalling downward momentum.
A speculative Sell/Short idea can be initiated with the TP set at R13.11 and the SL set at R15.42.
Consumer Discretionary
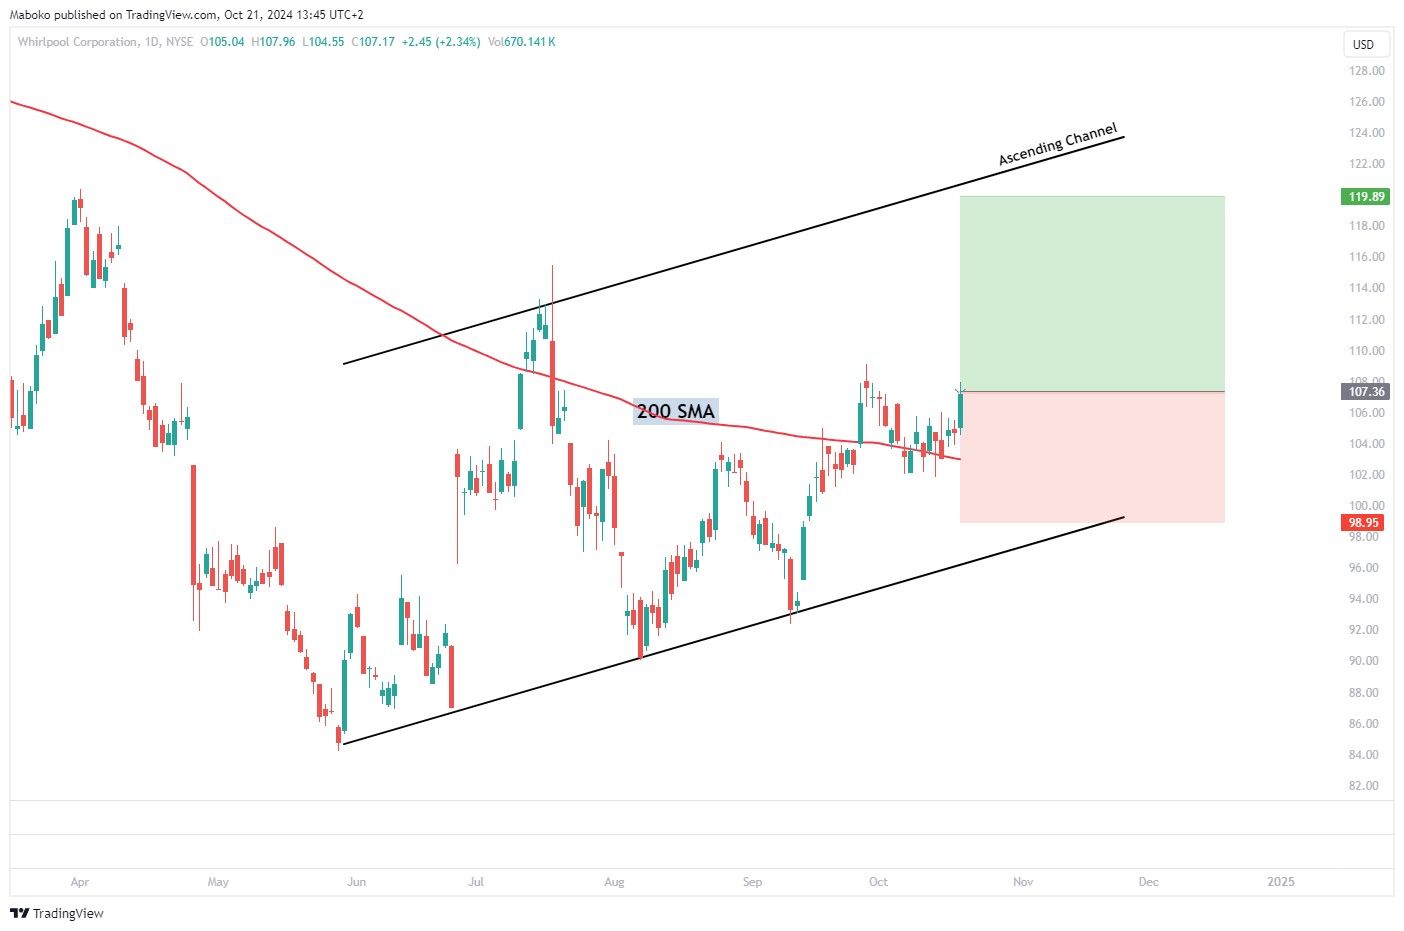
Whirlpool Corp. (WHR): Whirlpool Corp. manufactures and markets home appliances.
The share price has been trading in an ascending channel after testing the lower bounds of the channel at $93.25. The share price trading above the 200-day simple moving average (SMA) confirms the trend direction, suggesting that bulls are in charge of the trend.
A potential Buy/Long idea can be initiated with the take profit (TP) set at $119.89 and the stop loss (SL) set at $98.95.

Health Care
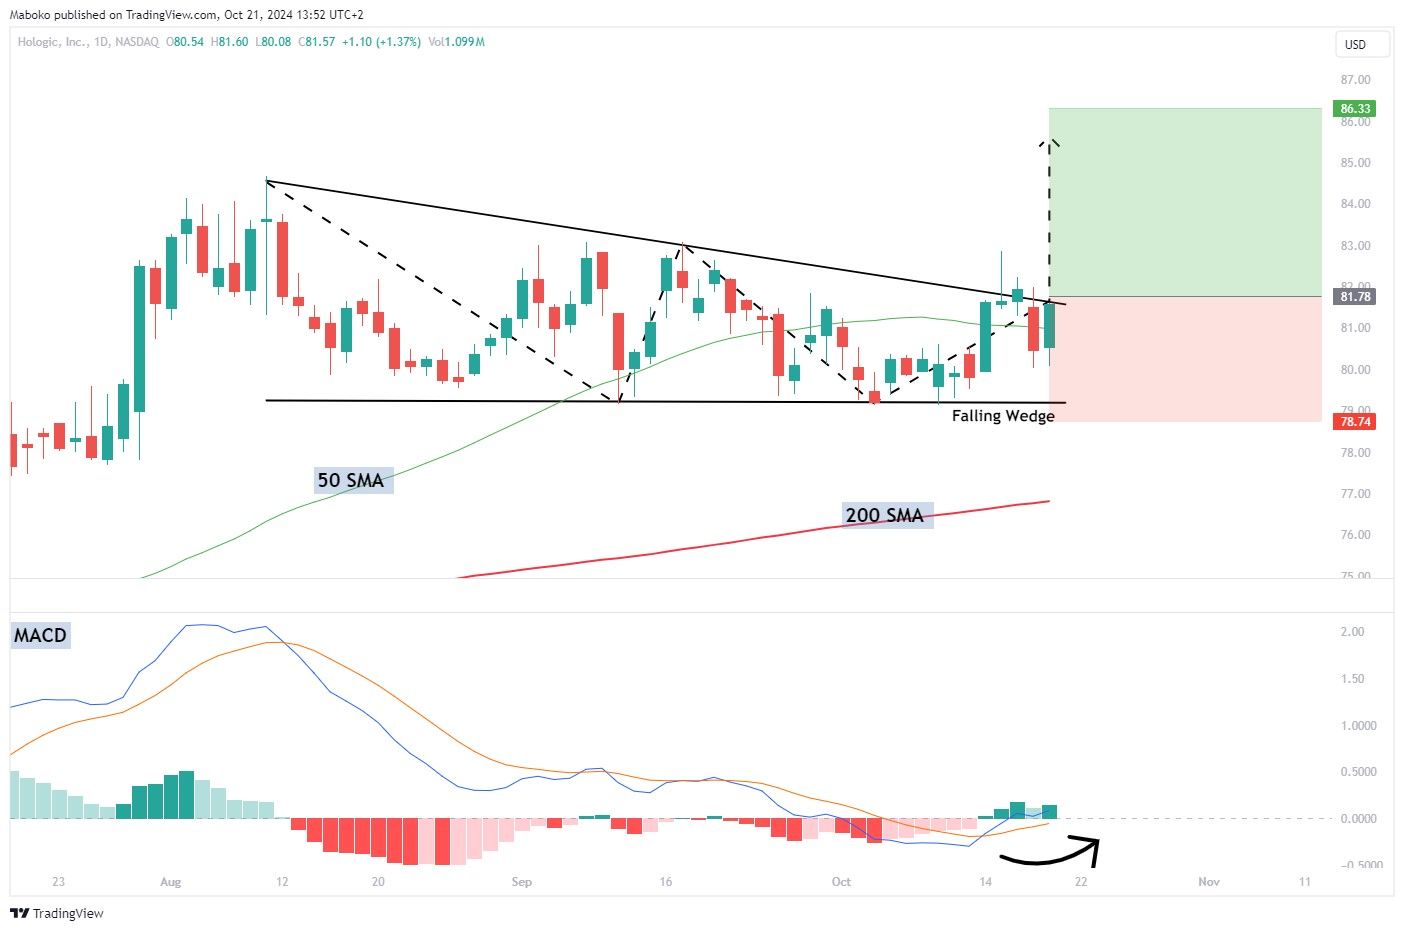
Hologic, Inc. (HOLX): Hologic, Inc. is in the development, manufacturing, and supply of diagnostics products, medical imaging systems, and surgical products, that focus on women’s health and well-being through early detection and treatment.
The share price has been trading in a falling wedge pattern but recently broke out. It is trading above the 200-day SMA, suggesting bulls are still in charge of the trend and the price closed above the 50-day SMA, suggesting trend continuation. The moving average convergence divergence (MACD) has made a bullish crossover, signalling momentum to the upside.
A speculative Buy/Long can be initiated with the TP set at $86.33 and the SL set at $78.74.
Utilities
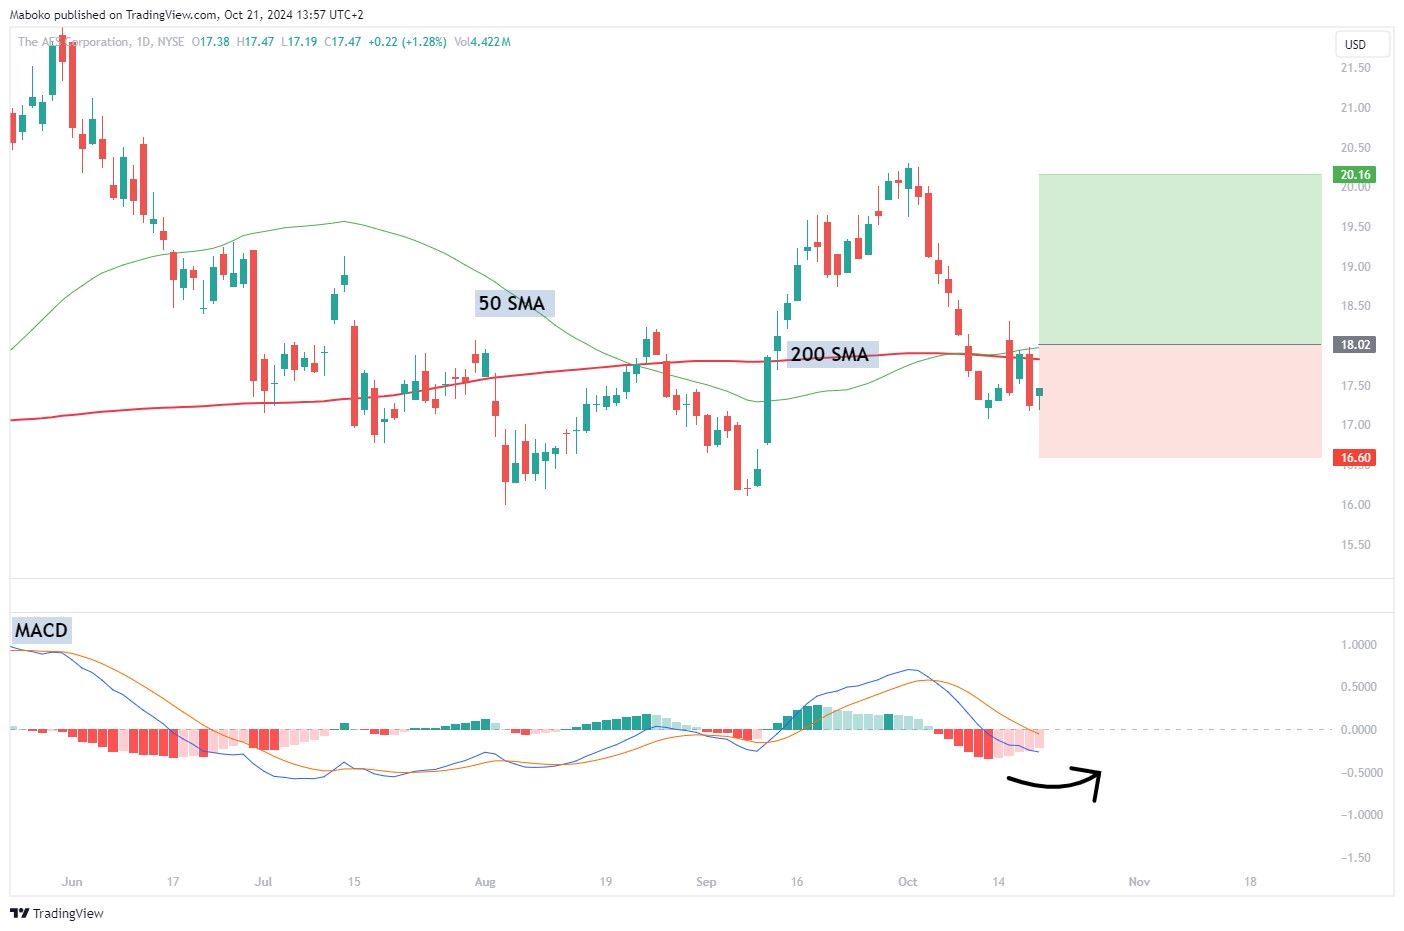
The AES Corp. (AES): The AES Corp. provides power generation and utility services through its renewable and thermal generation facilities and distribution businesses.
The share recently had a golden cross, where the 50-day SMA crossed above the 50-day SMA, suggesting a change in trend direction. However, the price is trading below both SMAs. The MACD is yet to confirm a bullish crossover for momentum to the upside.
A potential Buy/Long can be initiated with the TP set at $20.16 and the SL set at $16.60.
Disclaimer:
Any opinions, views, analysis or other information provided in this article is provided by BCS Markets SA trading as BROCKSTOCK as general market commentary and should not be viewed as advice according to the FAIS Act of 2002. BCS Markets SA does not warrant the correctness, accuracy, timeliness, reliability or completeness of any information provided by third parties. You must rely upon your judgement in all aspects of your investment decisions and all decisions are made at your own risk. BCS Markets SA and any of its employees shall not be responsible for and will not accept any liability for any direct or indirect loss including without limitation any loss of profit which may arise directly or indirectly from use of the market commentary. The content contained within the article is subject to change at any time without notice. BCS Markets SA is an authorised financial services provider FSP No. 51404.