
Financials
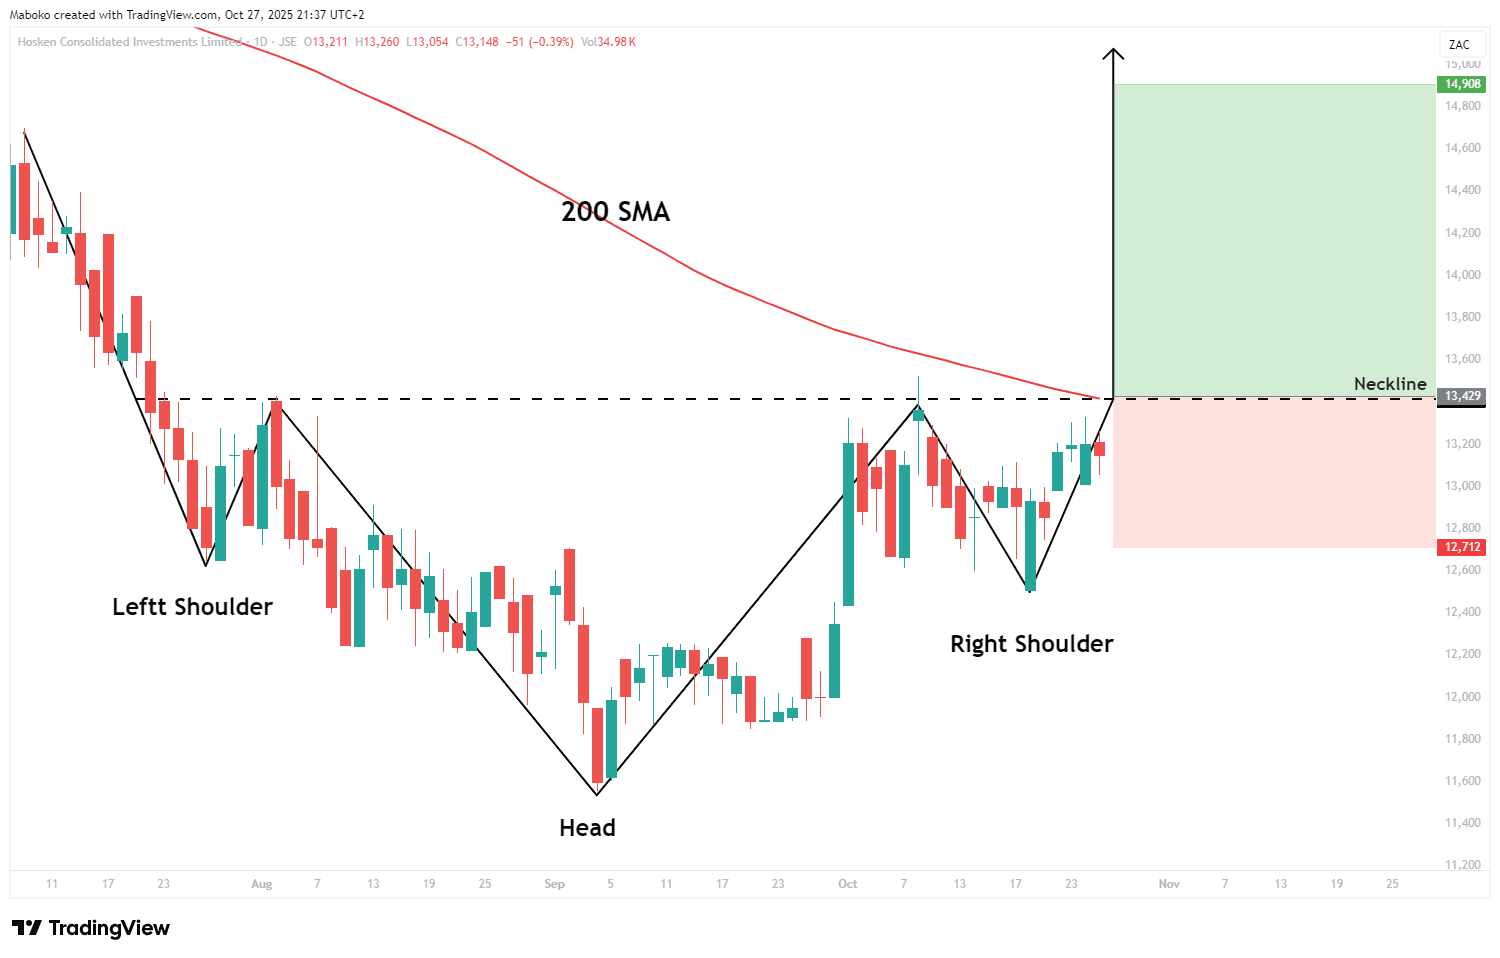
Hosken Consolidated Investments Ltd (HCI): Hosken is a holding company, which provides investments. It operates through media and broadcasting, gaming, transport, properties, coal mining, branded products and Manufacturing.
An inverted head and shoulders pattern is unfolding, with the right shoulder yet to confirm the formation. A close above R135, which coincides with the 200-day SMA, will confirm the neckline breakout, signalling a potential change in trend direction.
A potential Buy/Long idea can be initiated, with the target set at R149.08 and the stop loss set at R127.12.
Industrials
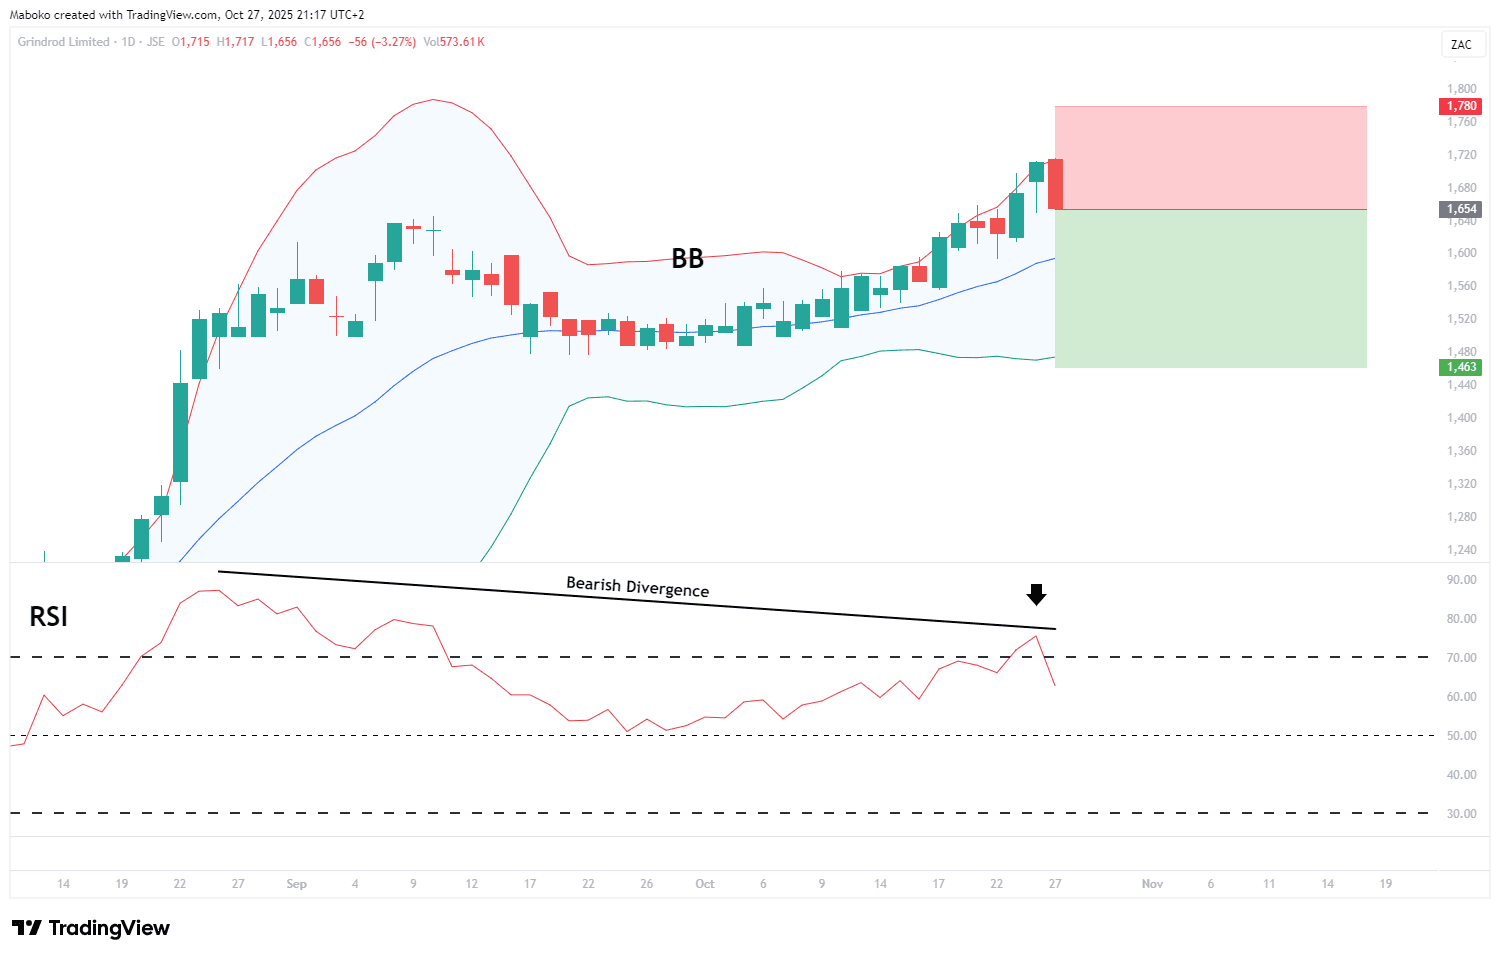
Grindrod Ltd (GND): Grindrod is in the business of freight solutions.
The share price has been trading near the upper band of the expanding bollinger bands (BB), making a new high. However, the Relative Strength Index (RSI) has formed a bearish divergence, signalling weakening upward momentum and the potential for a short-term pullback.
A speculative Sell/Short idea can be initiated, with the target set at R14.63 and the stop loss set at R17.80.
Basic Materials
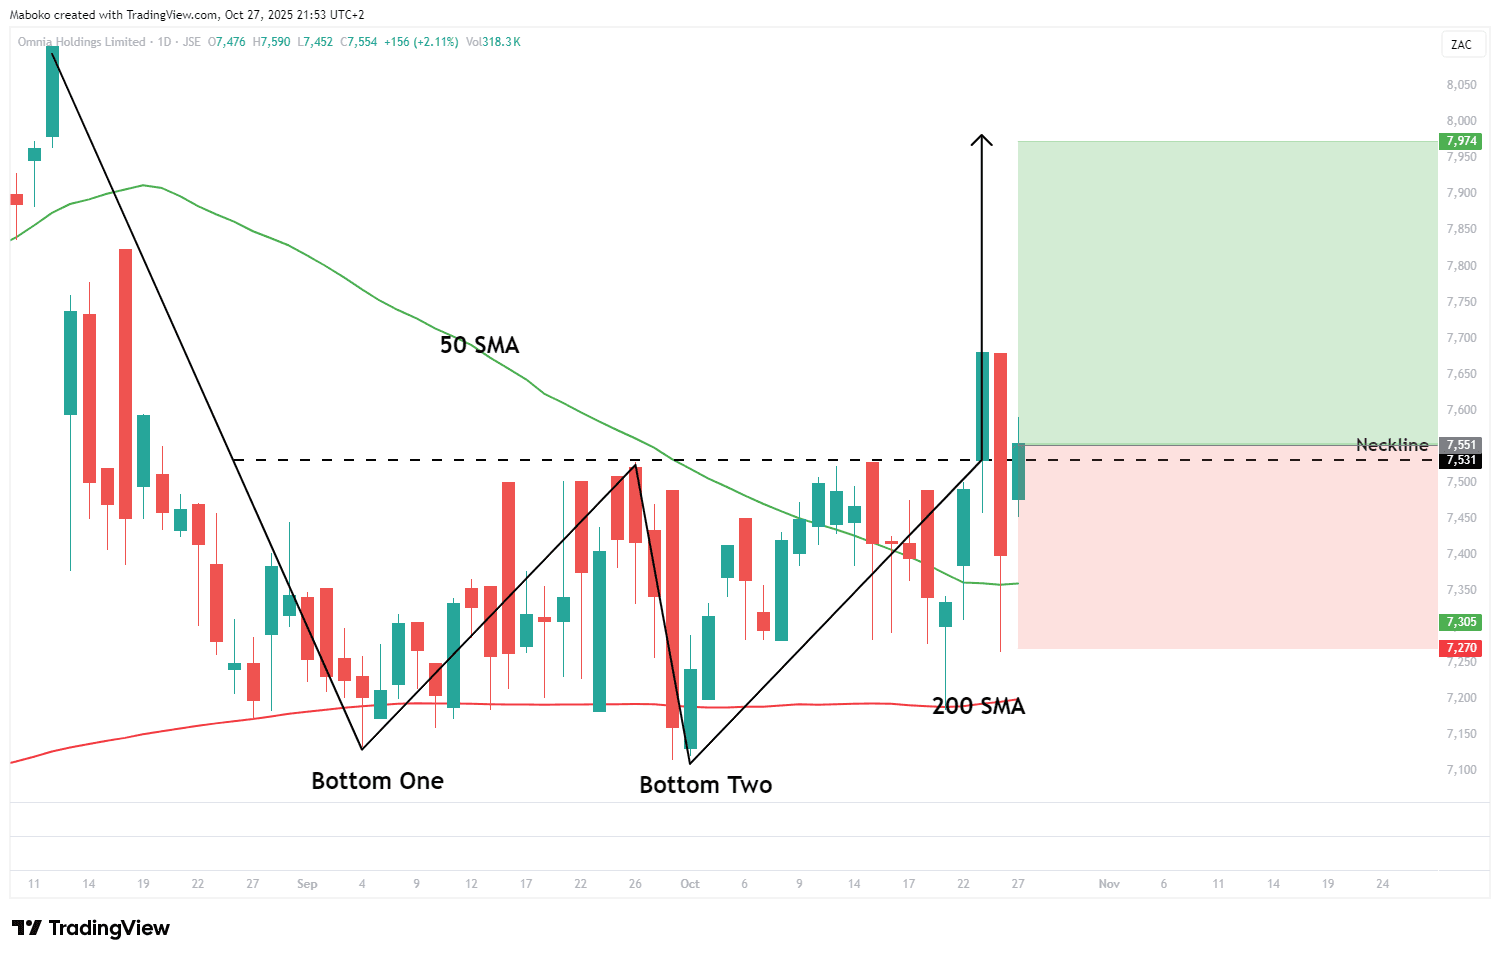
Omnia Holdings Ltd (OMN): Omnia is in the business of manufacturing and distribution of fertilizers and chemicals.
The double bottom pattern has been confirmed with a close above the neckline at R75.31. Both troughs of the pattern tested the 200-day SMA as a dynamic support level, while the recent close above the 50-day SMA reaffirms the continuation of the upward trend.
A potential Buy/Long idea can be initiated, with the target set at R79.74 and the stop loss set at R72.70.
Industrials
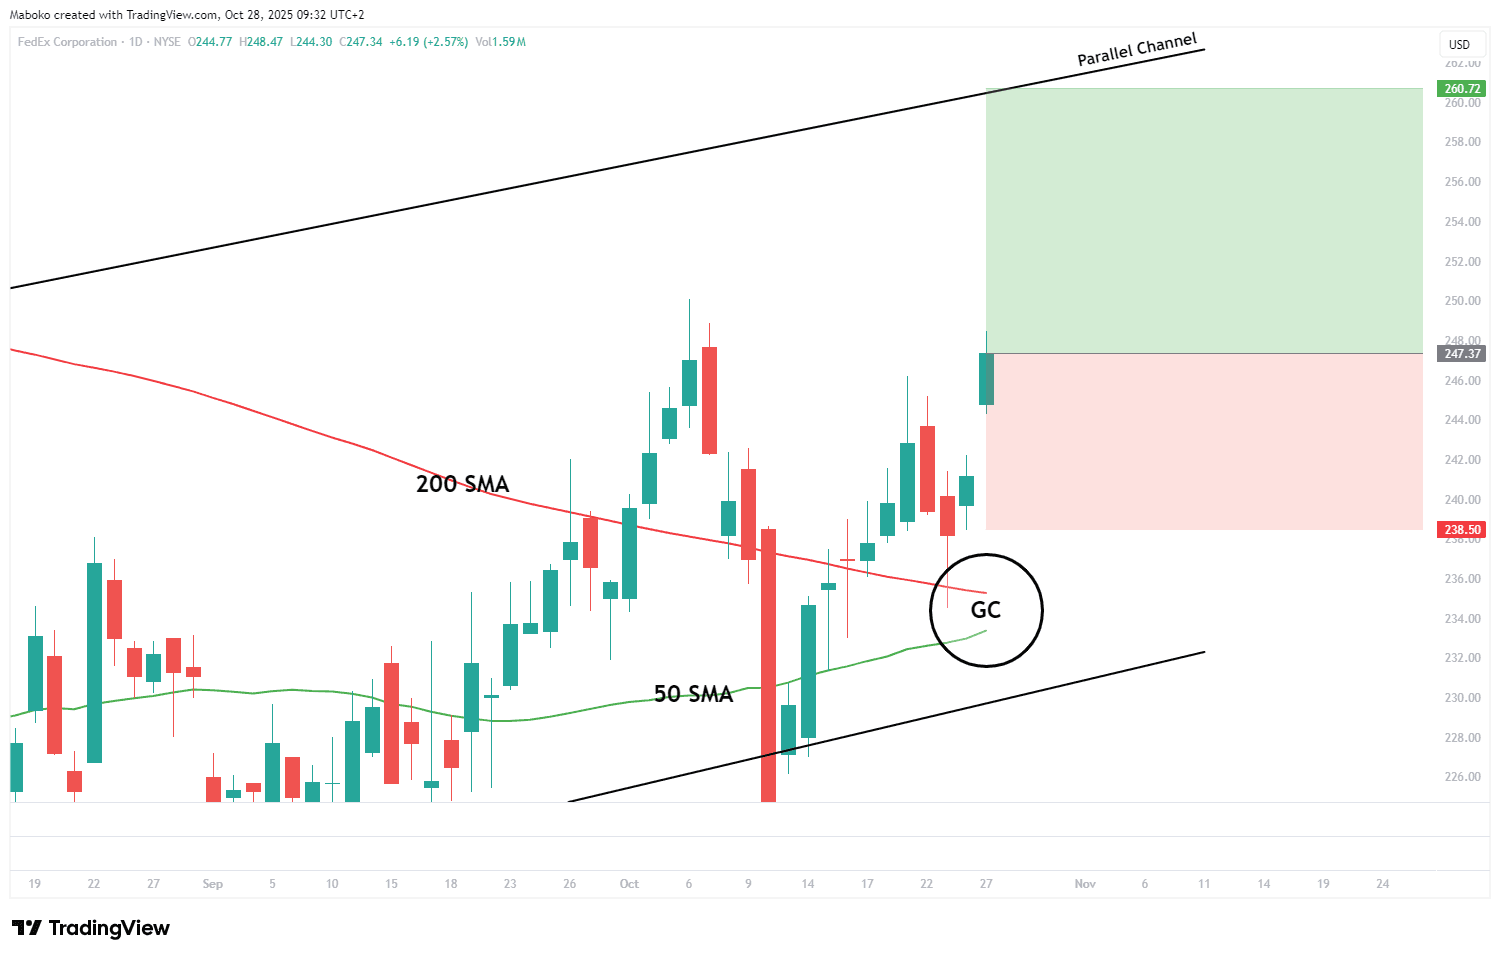
FedEx Corp (FDX): FedEx is a holding company, which is in the business of transportation, e-commerce, business services and business solutions.
There is an imminent golden cross (GC), where the 50-day simple moving average (SMA) is set to cross above the 200-day simple moving average (SMA), signalling a potential long-term trend reversal. The price has recently tested the support of the rising parallel channel and is now heading toward the channel’s resistance level, reinforcing the bullish outlook.
A potential Buy/Long idea can be initiated, with the target set at $260.72 and the stop loss set at $238.50.
Financials
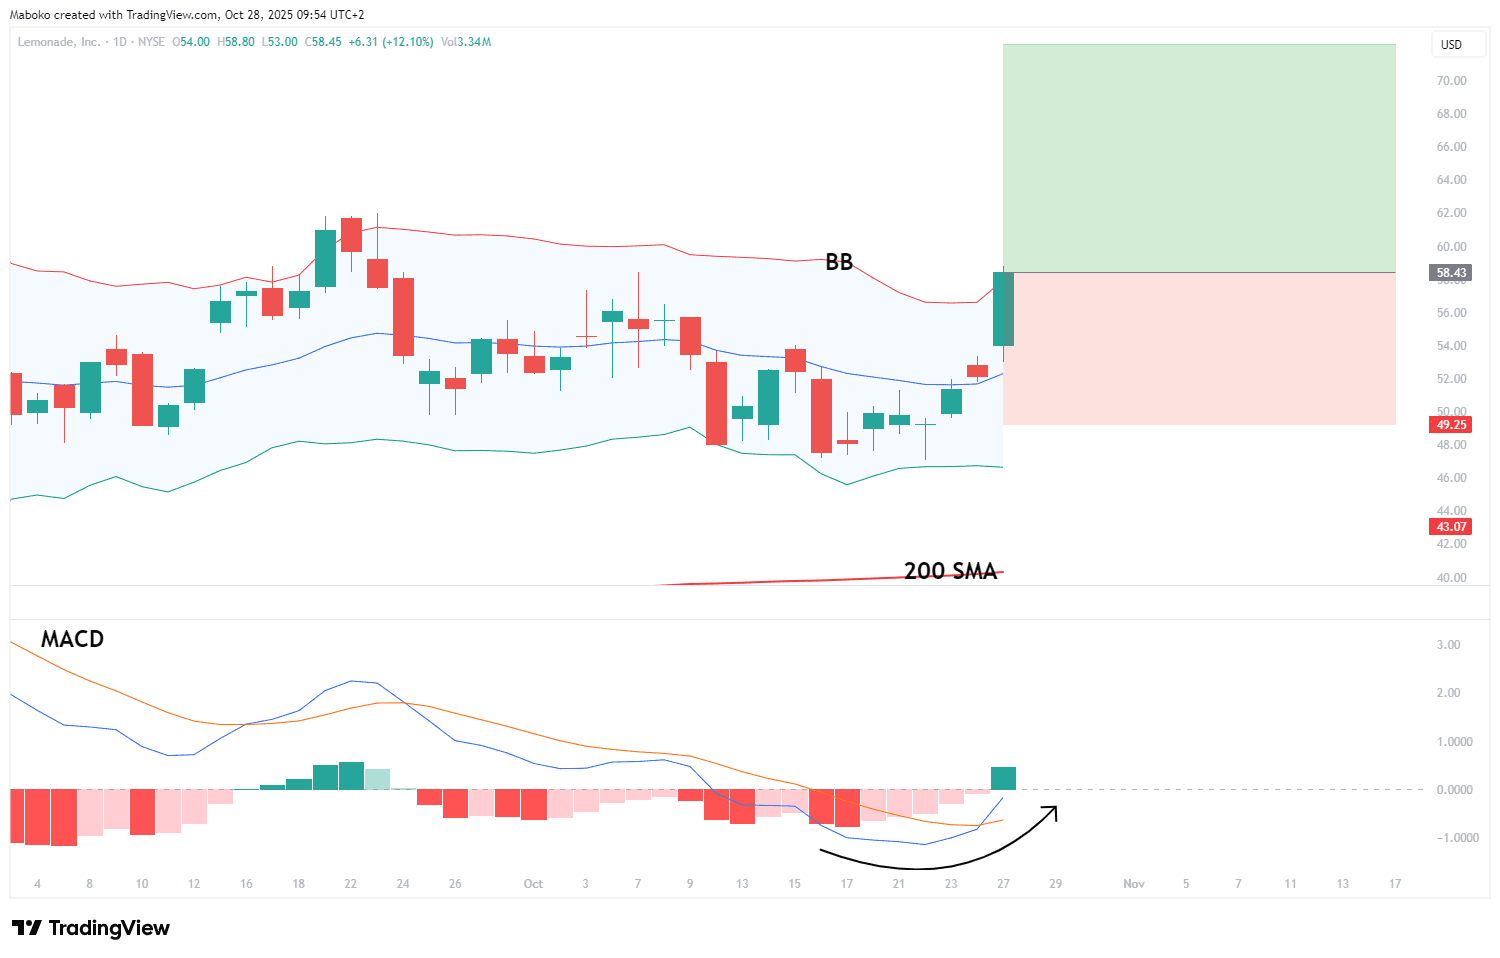
Lemonade Inc (LMND): Lemonade is a holding company, which is in the business of insurance services. The firm's products include renters and homeowners insurance and pet insurance.
The stock price closed above the upper band of the expanding bollinger bands (BB), indicating strong bullish momentum. Trading above the 200-day simple moving average (SMA) further confirms that the bulls remain in control of the trend. As confluence, the moving average convergence divergence (MACD) has made a bullish crossover, supporting continued upward momentum.
A potential Buy/Long idea can be initiated, with the target set at $72.20 and the stop loss set at $49.25
Industrials
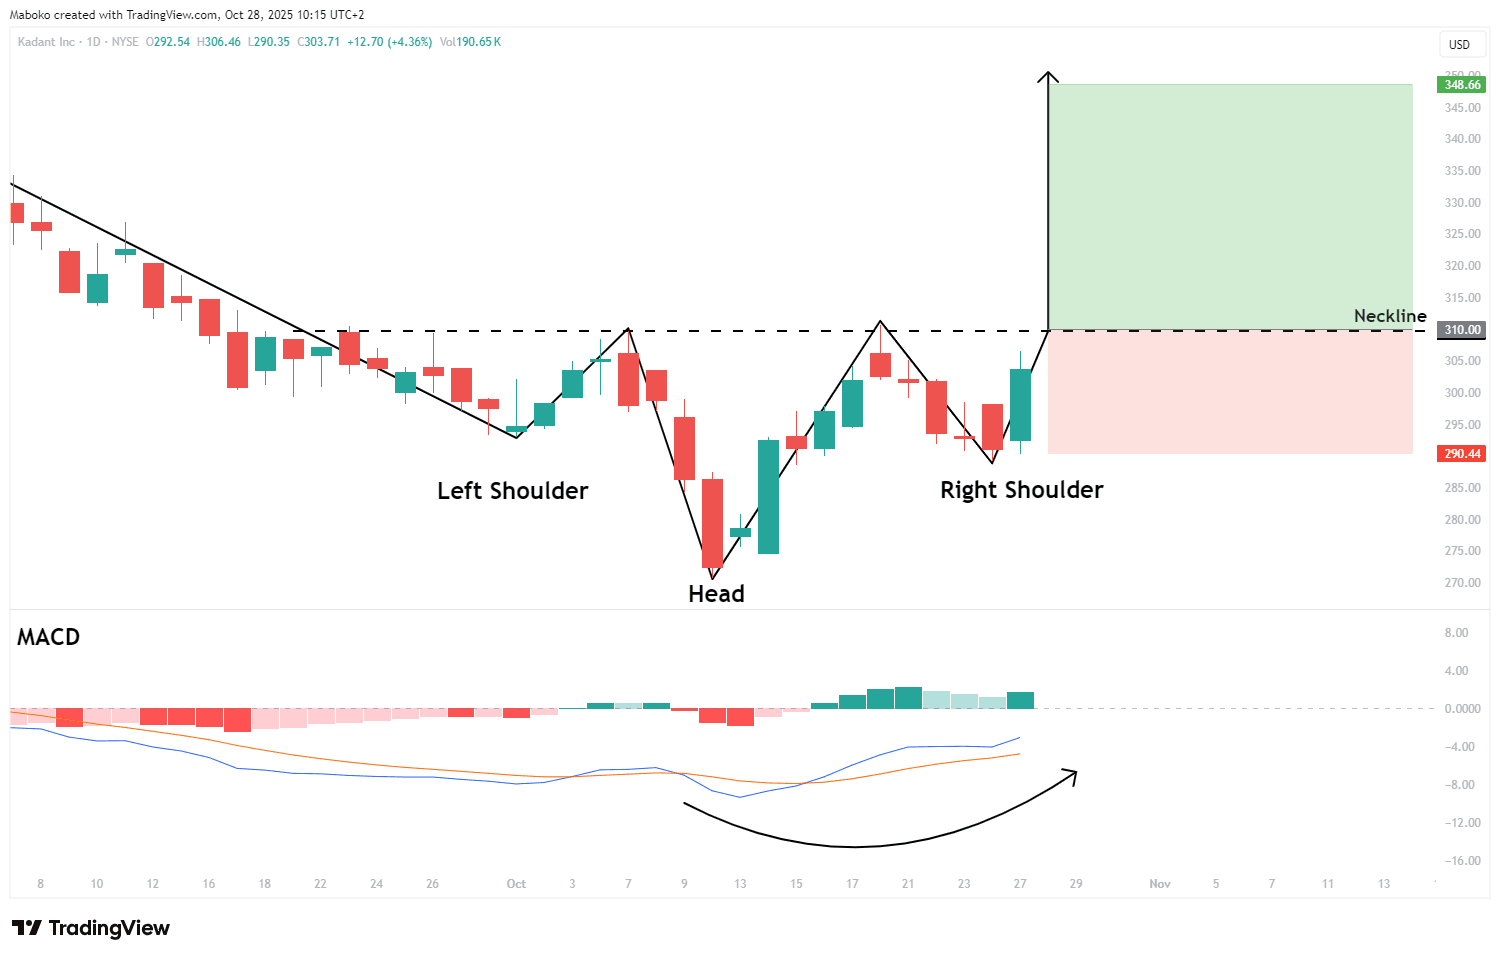
Kadant Inc (KAI): Kadant operates as a global supplier of critical components and engineered systems used in process industries worldwide.
An inverse head and shoulders pattern is unfolding, with the right shoulder currently forming. A close above the neckline at $310 will confirm the bullish reversal pattern. As confluence, the moving average convergence divergence (MACD) shows room for further upward momentum, supporting the potential breakout.
A potential Buy/Long idea can be initiated, with the target set at $348.66 and the stop loss set at $290.44.
Disclaimer:
*Any opinions, views, analysis, or other information provided in this article is provided by BROKSTOCK SA trading as BROKSTOCK as general market commentary and should not be viewed as advice according to the FAIS Act of 2002. BROKSTOCK SA does not warrant the correctness, accuracy, timeliness, reliability, or completeness of any information provided by third parties. You must rely upon your judgement in all aspects of your investment decisions, and all decisions are made at your own risk. BROKSTOCK SA and any of its employees shall not be responsible for and will not accept any liability for any direct or indirect loss, including, without limitation, any loss of profit which may arise directly or indirectly from the use of the market commentary. The content contained within the article is subject to change at any time without notice. BROKSTOCK SA is an authorised financial services provider - FSP No. 51404. T&Cs and Disclaimers are applicable: https://brokstock.co.za/
** This article was prepared by BROKSTOCK analyst Maboko Seabi
© 2025 BROKSTOCK SA (PTY) LTD.
BROKSTOCK SA (PTY) LTD is an authorised Financial Service Provider and is regulated by the South African Financial Sector Conduct Authority (FSP No.51404). BROKSTOCK SA (PTY) LTD Proprietary Limited trading as BROKSTOCK. BROKSTOCK SA (PTY) LTD t/a BROKSTOCK acts solely as an intermediary in terms of the FAIS Act, rendering only an intermediary service (i.e., no market making is conducted by BROKSTOCK SA (PTY) LTD t/a BROKSTOCK) in relation to derivative products (CFDs) offered by the liquidity providers. Therefore, BROKSTOCK SA (PTY) LTD t/a BROKSTOCK does not act as the principal or the counterparty to any of its transactions.
The materials on this website (the “Site”) are intended for informational purposes only. Use of and access to the Site and the information, materials, services, and other content available on or through the Site (“Content”) are subject to the laws of South Africa.
Risk notice Margin trading in financial instruments carries a high level of risk, and may not be suitable for all users. It is essential to understand that investing in financial instruments requires extensive knowledge and significant experience in the investment field, as well as an understanding of the nature and complexity of financial instruments, and the ability to determine the volume of investment and assess the associated risks. BROKSTOCK SA (PTY) LTD pays attention to the fact that quotes, charts and conversion rates, prices, analytic indicators and other data presented on this website may not correspond to quotes on trading platforms and are not necessarily real-time nor accurate. The delay of the data in relation to real-time is equal to 15 minutes but is not limited. This indicates that prices may differ from actual prices in the relevant market, and are not suitable for trading purposes. Before deciding to trade the products offered by BROKSTOCK SA (PTY) LTD, a user should carefully consider his objectives, financial position, needs and level of experience. The Content is for informational purposes only and it should not construe any such information or other material as legal, tax, investment, financial, or other advice. BROKSTOCK SA (PTY) LTD will not accept any liability for loss or damage as a result of reliance on the information contained within this Site including data, quotes, conversion rates, etc.
Third party content BROKSTOCK SA (PTY) LTD may provide materials produced by third parties or links to other websites. Such materials and websites are provided by third parties and are not under BROKSTOCK SA (PTY) LTD's direct control. In exchange for using the Site, the user agrees not to hold BROKSTOCK SA (PTY) LTD, its affiliates or any third party service provider liable for any possible claim for damages arising from any decision user makes based on information or other Content made available to the user through the Site.
Limitation of liability The user’s exclusive remedy for dissatisfaction with the Site and Content is to discontinue using the Site and Content. BROKSTOCK SA (PTY) LTD is not liable for any direct, indirect, incidental, consequential, special or punitive damages. Working with BROKSTOCK SA (PTY) LTD you are trading share CFDs. When trading CFDs on shares you do not own the underlying asset. Share CFDs are complex instruments and come with a high risk of losing money rapidly due to leverage. A high percentage of retail traders accounts lose money when trading CFDs with their provider. All rights reserved. Any use of Site materials without permission is prohibited.