JSE & NYSE Shares Analysis | 8-12 July

JSE SHARES
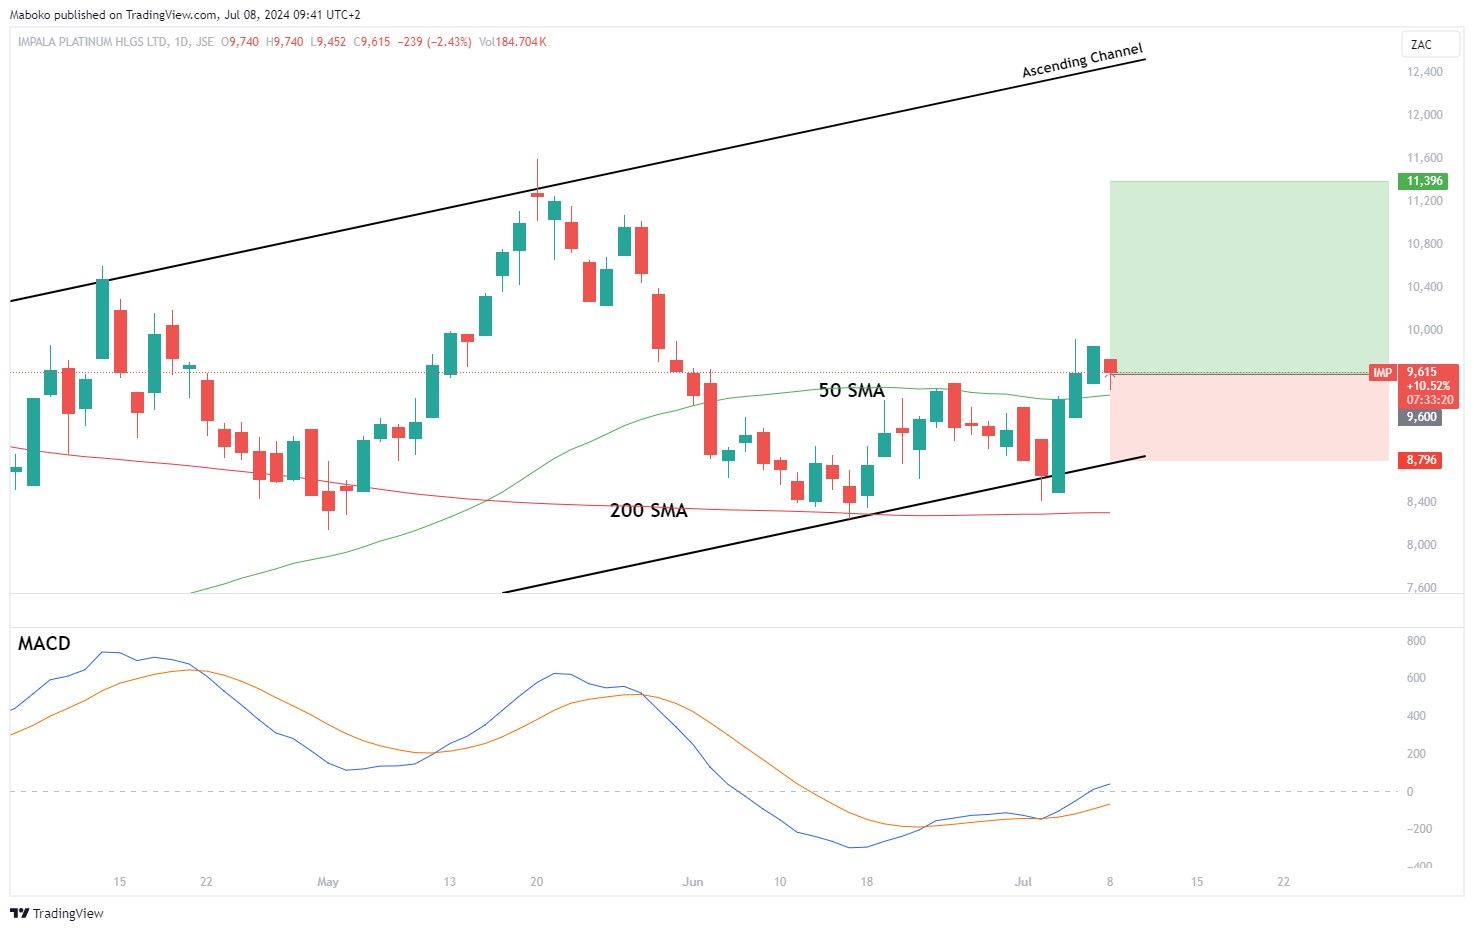
Impala Platinum Holdings Ltd (IMP)| Mining: Impala platinum holdings Ltd. is in the business of mining, refining and marketing of platinum group metals (PGMs). It operates in South Africa and Zimbabwe.
The share price is trading in an ascending channel from the lows of R56.88 and has been making higher highs and higher lows. The price has tested the lower bound of the channel as well as the 200-day Simple Moving Average (SMA). The Moving Average Convergence Divergence (MACD) has made a bullish crossover, suggesting momentum to the upside is applicable. Additionally, the share is trading above the 200-day SMA, signalling that the bulls are in charge of the trend.
A potential buy/long idea can be initiated with a take profit (TP) set at R113.96 and the stop loss (SL) set at R87.96.
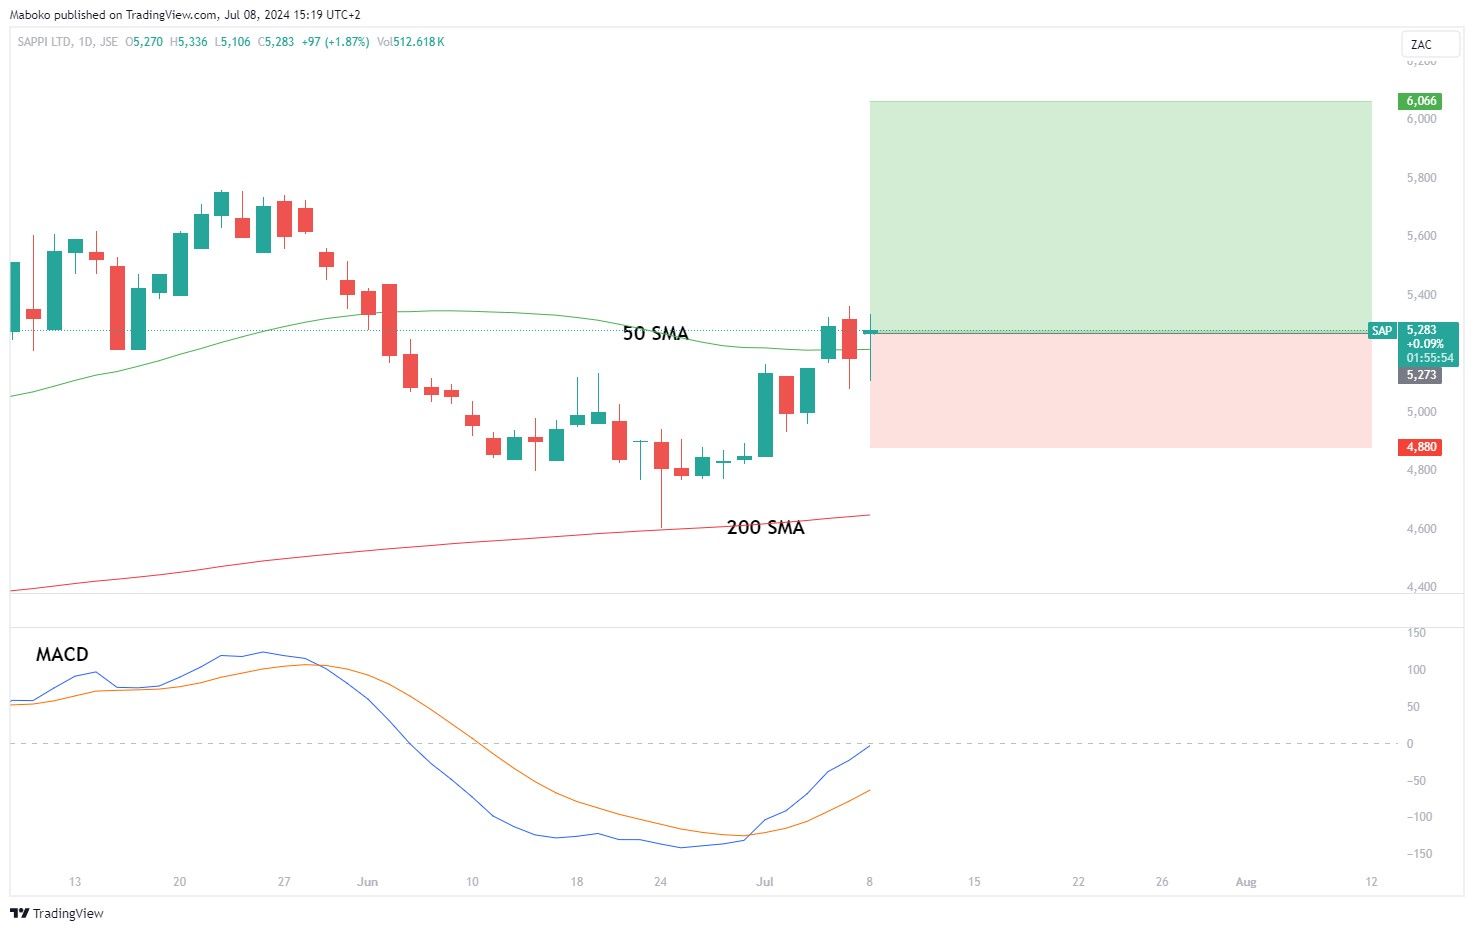
Sappi Ltd (SAP) | Process Industries: Sappi Ltd. Is a holding company, which is in
the business of provision of wood-fiber based solutions. Its products include
Dissolving pulp, specialties and packaging papers, printing and writing papers,
and forestry.
The upward trajectory, making higher highs and higher lows. The price is currently trading above the 200-day Simple Moving Average (SMA), signalling the bulls are in charge of the trend. The Crossover the 50-day Simple Moving Average (SMA) combined with the Moving Average Convergence Divergence (MACD) bullish crossover, suggest momentum to the upside is favoured.
A potential buy/long idea can be initiated with a take profit (TP) set at R60.66 and the stop loss (SL) set at R48.80.
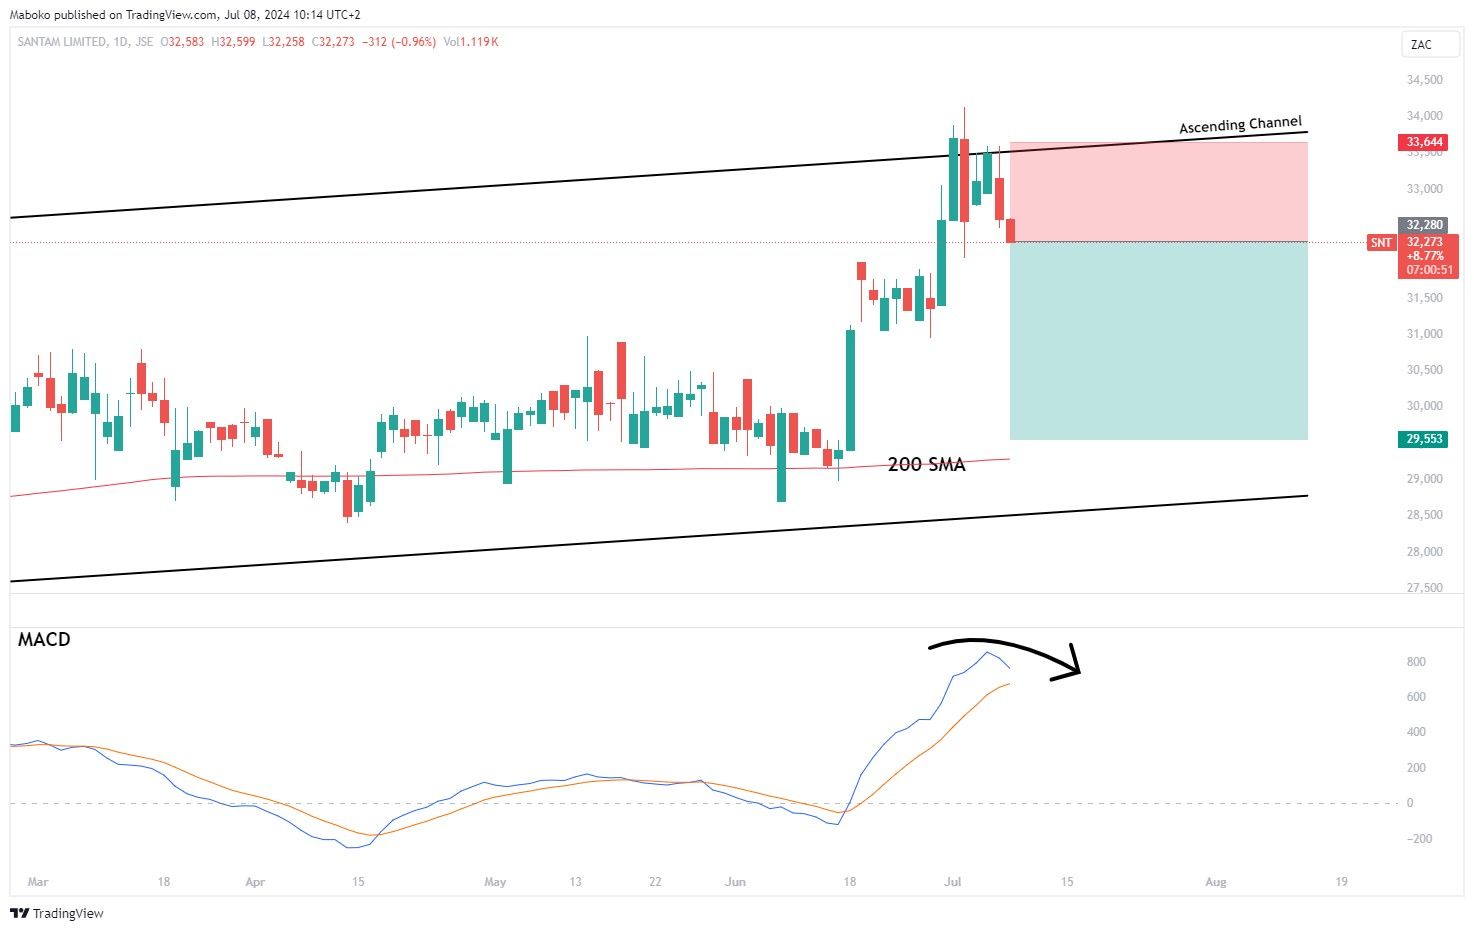
Santam Ltd (SNT) | Finance: Santam Ltd. is in the business of insurance
and investment services. The insurance service offers conventional, credit,
alternative risk transfer, and Sanlam emerging market (SEM) general insurances.
The investment service includes all investment related activities undertaken by
the company.
The share price is trading in an ascending channel, having tested the upper bound of the channel at the R335.00 region. The Moving Average Convergence Divergence (MACD) yet to confirm bearish crossover, suggesting momentum to the downside is applicable. Traders should be wary of the 200-day Simple Moving Average, which signals that the trend is still bullish.
A speculative sell/short idea can be initiated with a take profit (TP) set at R295.53 and the stop loss (SL) set at R336.44.
US STOCKS
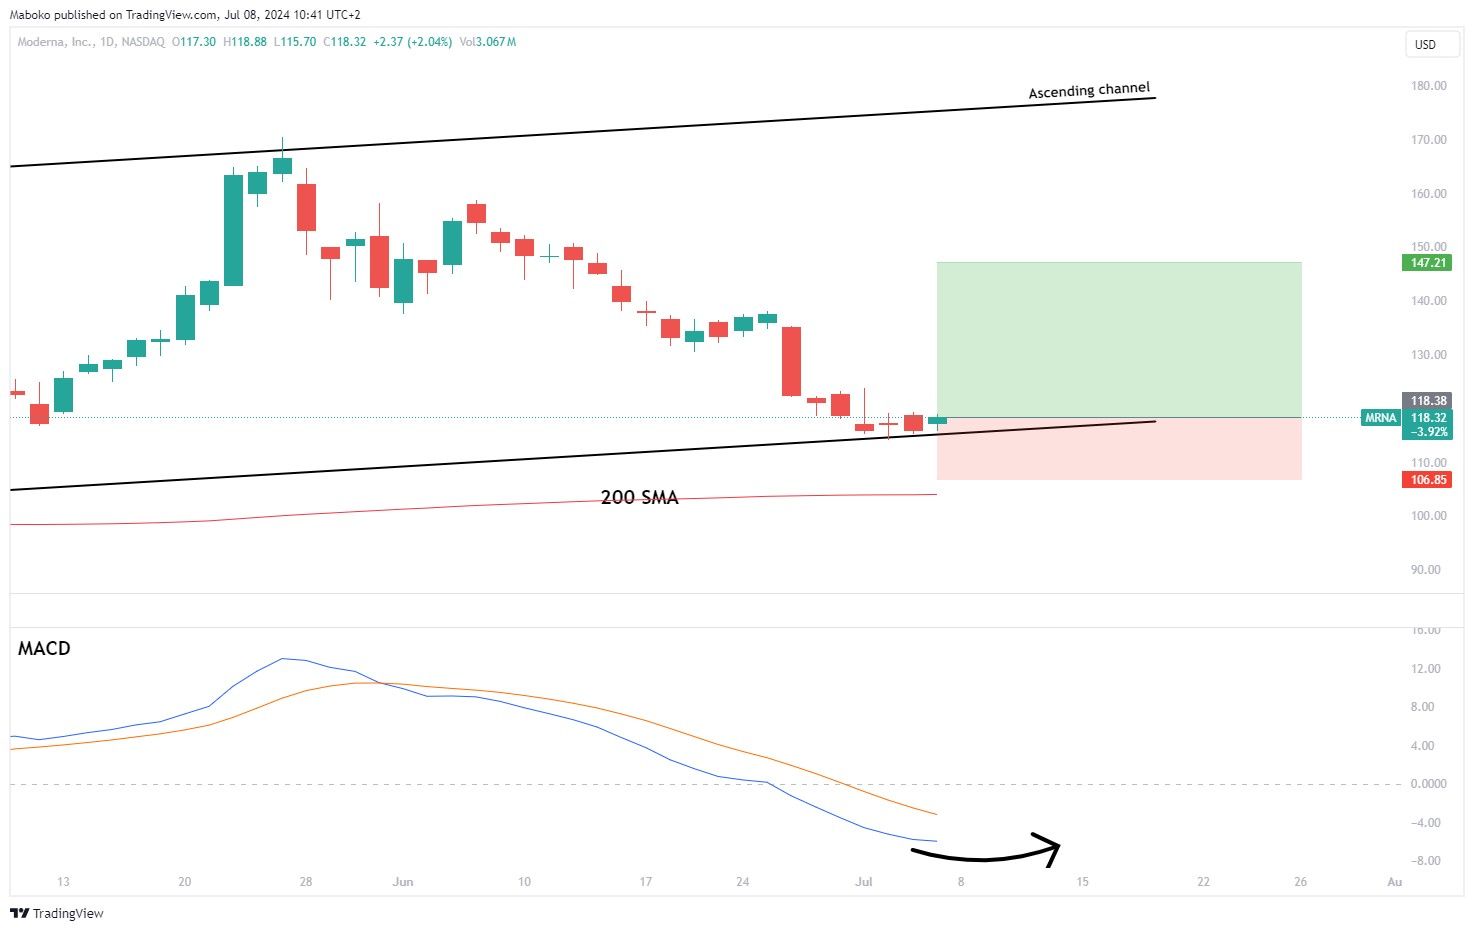
Moderna, Inc.(MRNA) | Health Technology: Moderna, Inc.is in the business of development of transformative medicines based on messenger ribonucleic acid (mRNA). Its products include prophylactic vaccines, cancer vaccines, intratumoral immuno-oncology, localised regenerative therapeutics, systemic secreted therapeutics, and systemic intracellular therapeutics.
The share price is trading in an ascending channel,the price tested the lower bound of the channel. Additionally ,the price is trading above the 200-day Simple moving average (SMA),signalling that the bulls are in charge of the trend.The Moving Average Convergence and Divergence (MACD) is yet to make a bullish crossover, suggesting momentum to the upside is applicable.
A Buy/Long idea can be initiated with a target set at $147.21 and the stop loss set at $106.85.
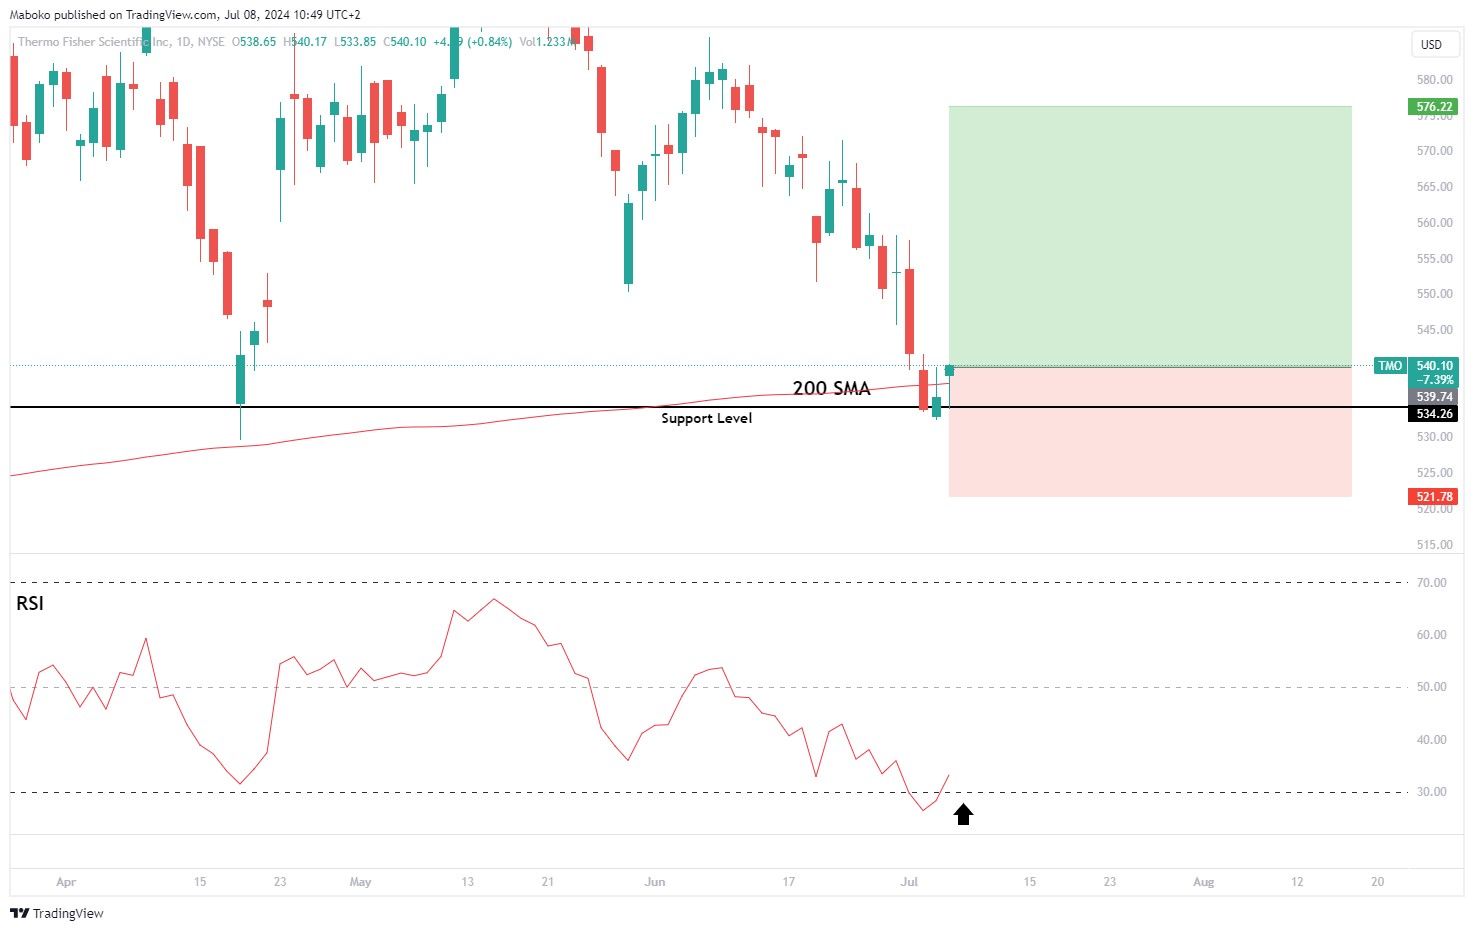
Thermo Fisher Scientific, Inc.(TMO) | Health Technology: Thermo Fisher Scientific, Inc. is
in the provision of analytical instruments, equipment, reagents, software,
services for research, analysis, discovery, and diagnostics.
The share price recently tested the support level at $534.26 and the 200-day Simple Moving Average (SMA). The Relative Strength Indicator (RSI) has made a crossover the overbought territory, suggesting the momentum to the upside is applicable.
A Buy/Long idea can be initiated with a target set at $579.22 and the stop loss set at $521.78.
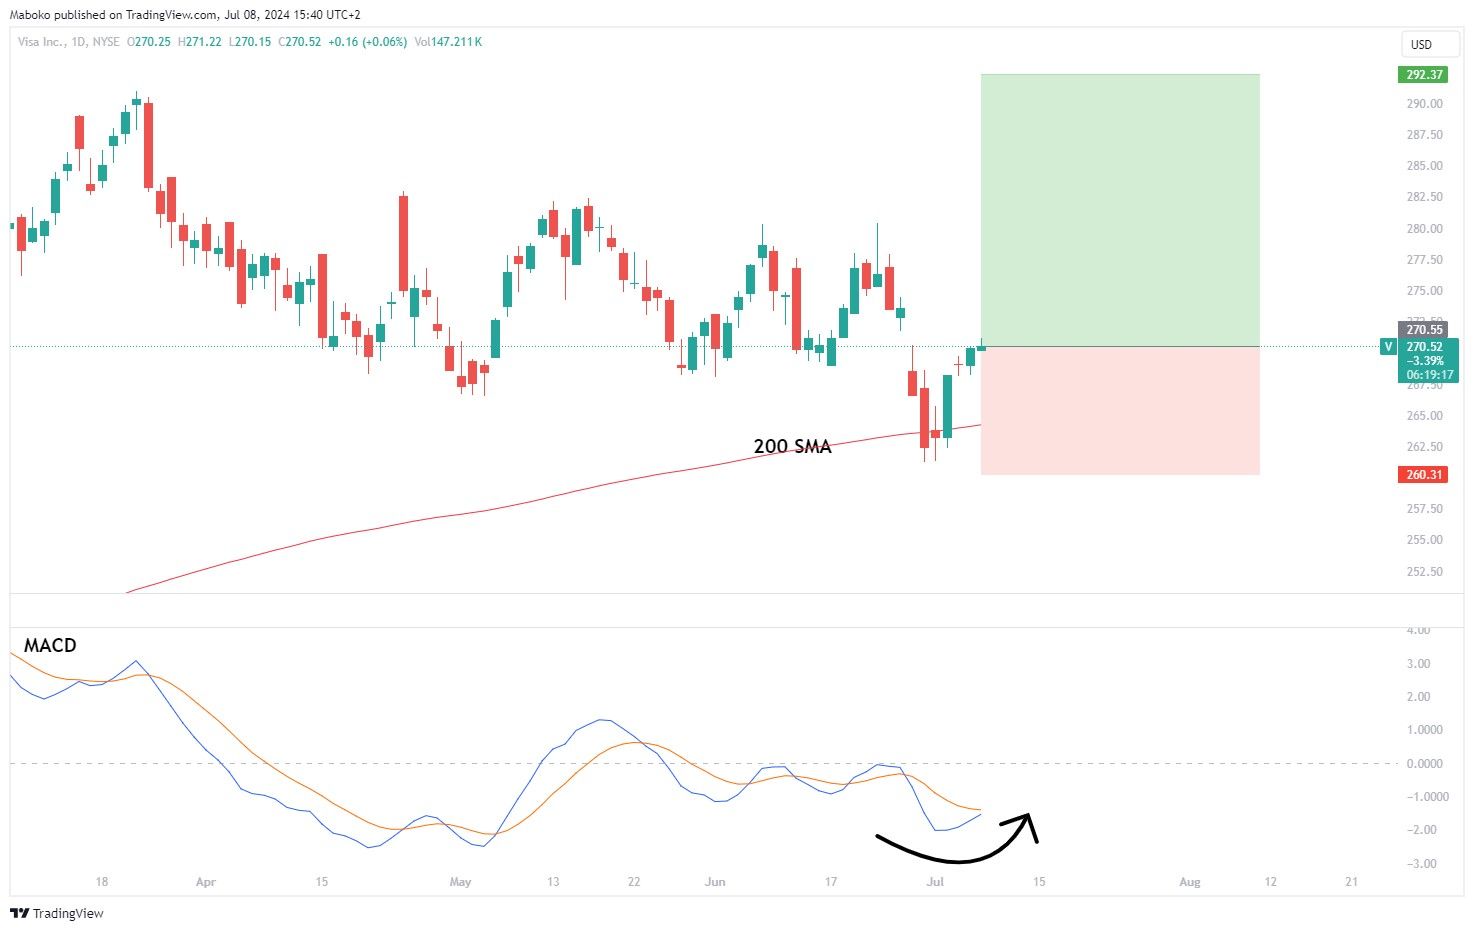
Visa, Inc.(V) | Commercial Services: Visa, Inc. is in the business of provision of
digital payment services. It also facilitates global commerce through the
transfer of value and information among a global network of consumers,
merchants, financial institutions, businesses, strategic partners and
government entities..
The share price retraced back to test 200-day Simple Moving Average (SMA), which has historically been a dynamic support/resistance level. The Moving Average Convergence and Divergence (MACD) is yet to make a bullish crossover, suggesting momentum to the upside is applicable.
A Buy/Long idea can be initiated with a target set at $292.37 and the stop loss set at $260.31.
Disclaimer: Any opinions, views, analysis or other information provided in this article is provided by BCS Markets SA trading as BROKSTOCK as general market commentary and should not be viewed as advice according to the FAIS Act of 2002. BCS Markets SA does not warrant the correctness, accuracy, timeliness, reliability or completeness of any information provided by third parties. You must rely upon your judgement in all aspects of your investment decisions and all decisions are made at your own risk. BCS Markets SA and any of its employees shall not be responsible for and will not accept any liability for any direct or indirect loss including without limitation any loss of profit which may arise directly or indirectly from use of the market commentary. The content contained within the article is subject to change at any time without notice. BCS Markets SA is an authorized financial services provider FSP No. 51404.
Read also


BCS Markets SA (Pty) Ltd. is an authorized Financial Service Provider and is regulated by the South African Financial Sector Conduct Authority (FSP No.51404). BCS Markets SA Proprietary Limited trading as BROKSTOCK.
The materials on this website (the “Site”) are intended for informational purposes only. Use of and access to the Site and the information, materials, services, and other content available on or through the Site (“Content”) are subject to the laws of South Africa.
Risk notice Margin trading in financial instruments carries a high level of risk, and may not be suitable for all users. It is essential to understand that investing in financial instruments requires extensive knowledge and significant experience in the investment field, as well as an understanding of the nature and complexity of financial instruments, and the ability to determine the volume of investment and assess the associated risks. BCS Markets SA (Pty) Ltd pays attention to the fact that quotes, charts and conversion rates, prices, analytic indicators and other data presented on this website may not correspond to quotes on trading platforms and are not necessarily real-time nor accurate. The delay of the data in relation to real-time is equal to 15 minutes but is not limited. This indicates that prices may differ from actual prices in the relevant market, and are not suitable for trading purposes. Before deciding to trade the products offered by BCS Markets SA (Pty) Ltd., a user should carefully consider his objectives, financial position, needs and level of experience. The Content is for informational purposes only and it should not construe any such information or other material as legal, tax, investment, financial, or other advice. BCS Markets SA (Pty) Ltd will not accept any liability for loss or damage as a result of reliance on the information contained within this Site including data, quotes, conversion rates, etc.
Third party content BCS Markets SA (Pty) Ltd. may provide materials produced by third parties or links to other websites. Such materials and websites are provided by third parties and are not under BCS Markets SA (Pty) Ltd.'s direct control. In exchange for using the Site, the user agrees not to hold BCS Markets SA (Pty) Ltd., its affiliates or any third party service provider liable for any possible claim for damages arising from any decision user makes based on information or other Content made available to the user through the Site.
Limitation of liability The user’s exclusive remedy for dissatisfaction with the Site and Content is to discontinue using the Site and Content. BCS Markets SA (Pty) Ltd. is not liable for any direct, indirect, incidental, consequential, special or punitive damages. Working with BCS Markets SA you are trading share CFDs. When trading CFDs on shares you do not own the underlying asset. Share CFDs are complex instruments and come with a high risk of losing money rapidly due to leverage. A high percentage of retail traders accounts lose money when trading CFDs with their provider. All rights reserved. Any use of Site materials without permission is prohibited.