
Industrials
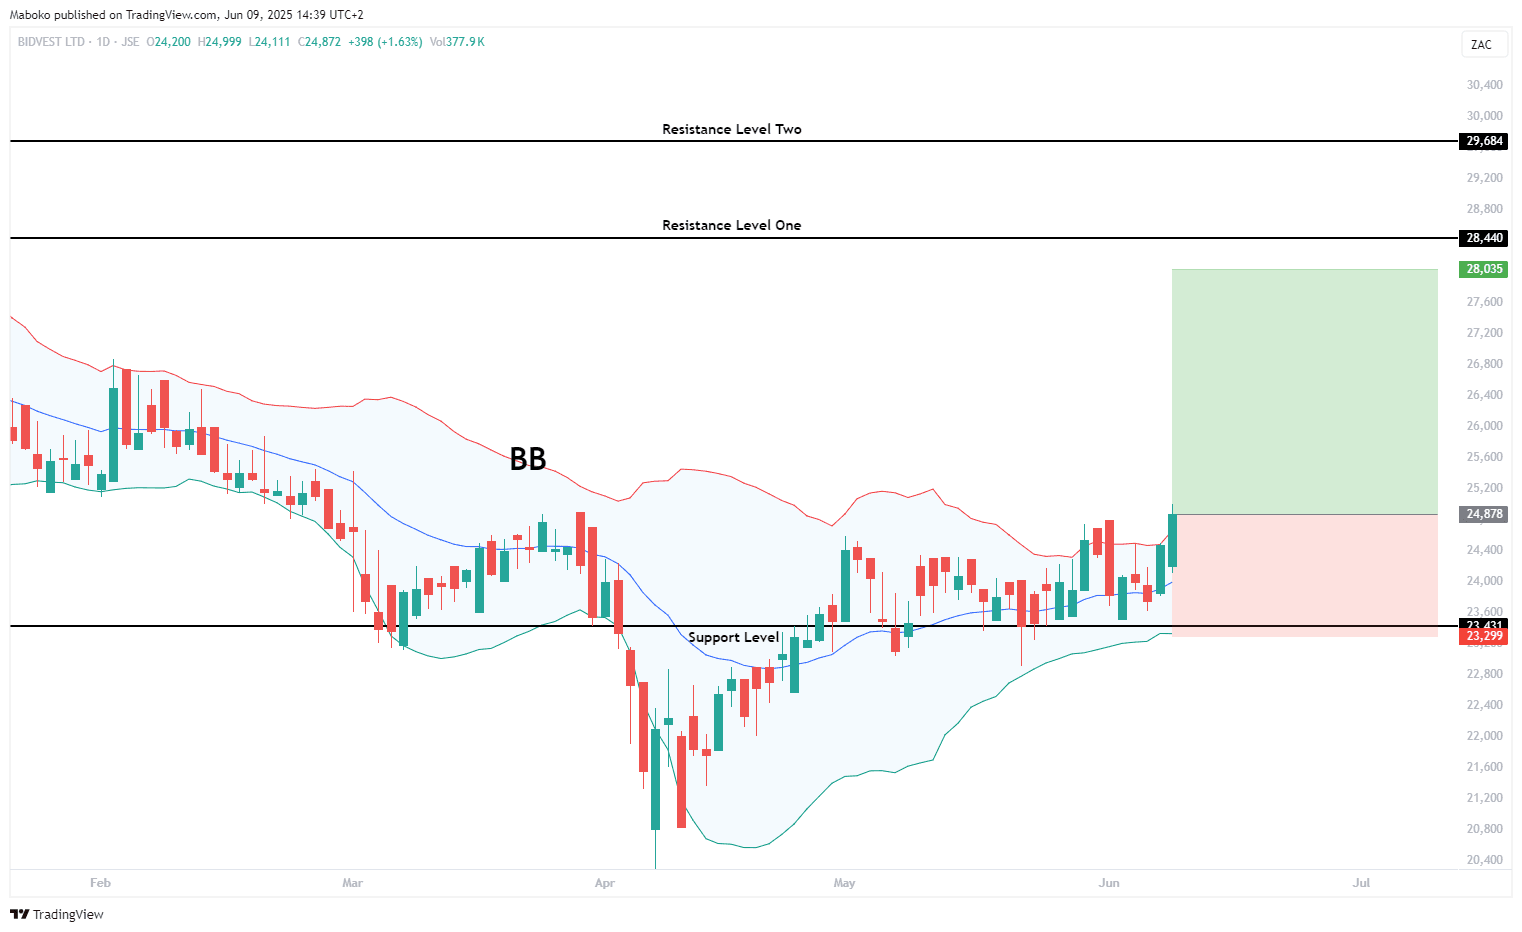
Bidvest Group Ltd. (BVT): The Bidvest Group is an investment holding company with subsidiaries in the services, trading, and distribution industries. It operates through commercial products, the automotive industry, financial services, freight, branded products, and properties.
Since February 2023, the share price has been range-bound between R234 (support) and R296 (resistance). Although the price temporarily breached the support level, it quickly recovered back into the range, indicating a false breakdown. As confluence, the recent close above the upper Bollinger Band suggests strong upward momentum and the potential for a test of the upper boundary of the range.
A potential Buy/Long idea can be initiated, with the target set at R280.35 and the stop loss set at R232.99.
Financials
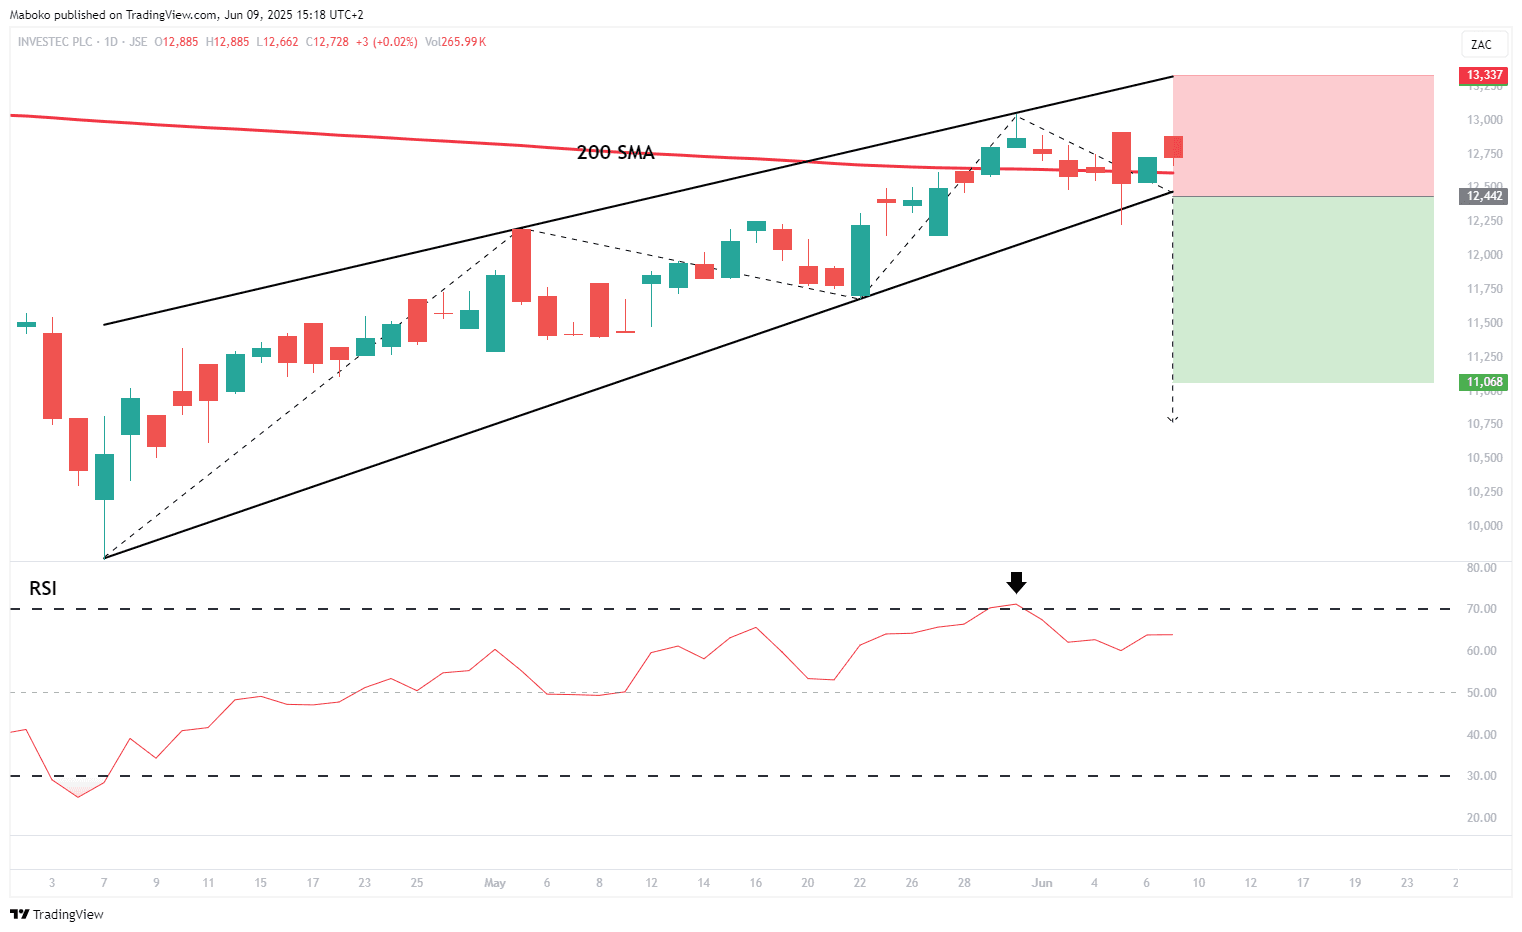
Investec Plc. (INP): Investec provides financial products and services. It operates in the following divisions: Wealth & Investment, Private Banking, Group Investments, and Corporate and Investment Banking.
A rising wedge trading pattern is currently unfolding, typically considered a bearish reversal setup. The price has not yet closed below the lower boundary of the wedge or the 200-day SMA (simple moving average), both of which would be key confirmation signals of a potential trend reversal. The RSI (relative strength indicator) is turning lower after reaching overbought territory, indicating weakening bullish momentum and supporting the possibility of a downside move if conditions are met.
A speculative Sell/Short idea can be initiated once the price closes below R124.50, with the target set at R110.68 and the stop loss set at R133.37.
Consumer Services
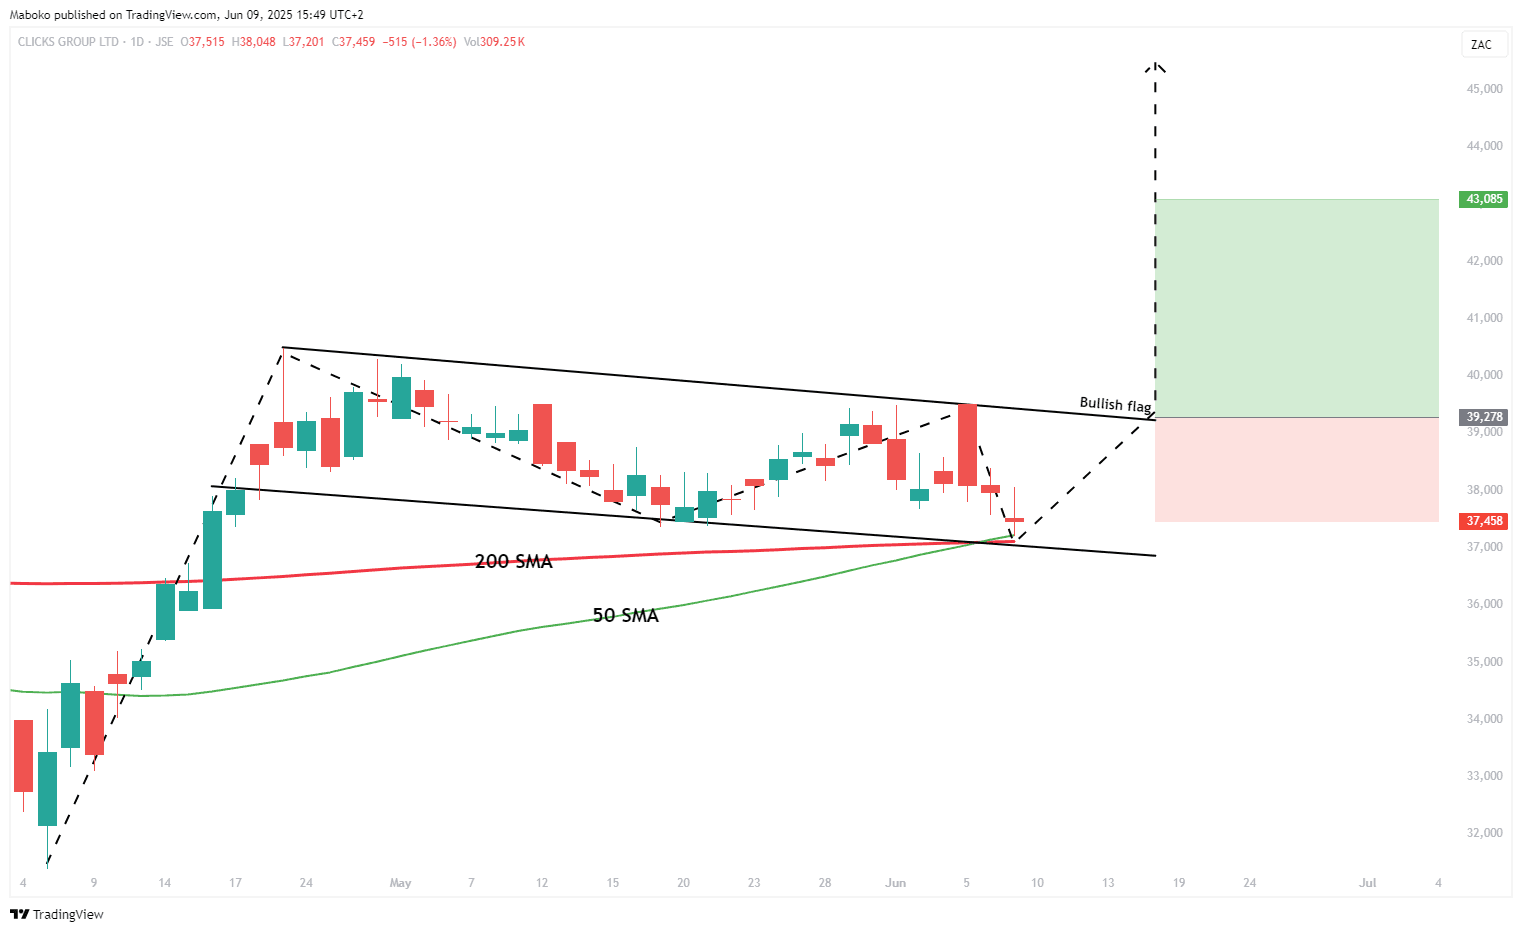
Clicks Group Ltd. (CLS): Clicks operates as an investment holding company. It retails healthcare products.
A bullish flag pattern is unfolding, typically indicating a continuation of the uptrend following a brief consolidation phase. This setup is further supported by the recent golden cross, where the 50-day SMA crossed above the 200-day SMA, signalling a potential shift toward sustained bullish momentum. Together, these signals suggest the possibility of further upside if the price breaks above the flag’s resistance.
A potential Buy/Long idea can be initiated once the price closes above R392.78, with the target set at R430.85 and the stop loss set at R374.58.
Health Care
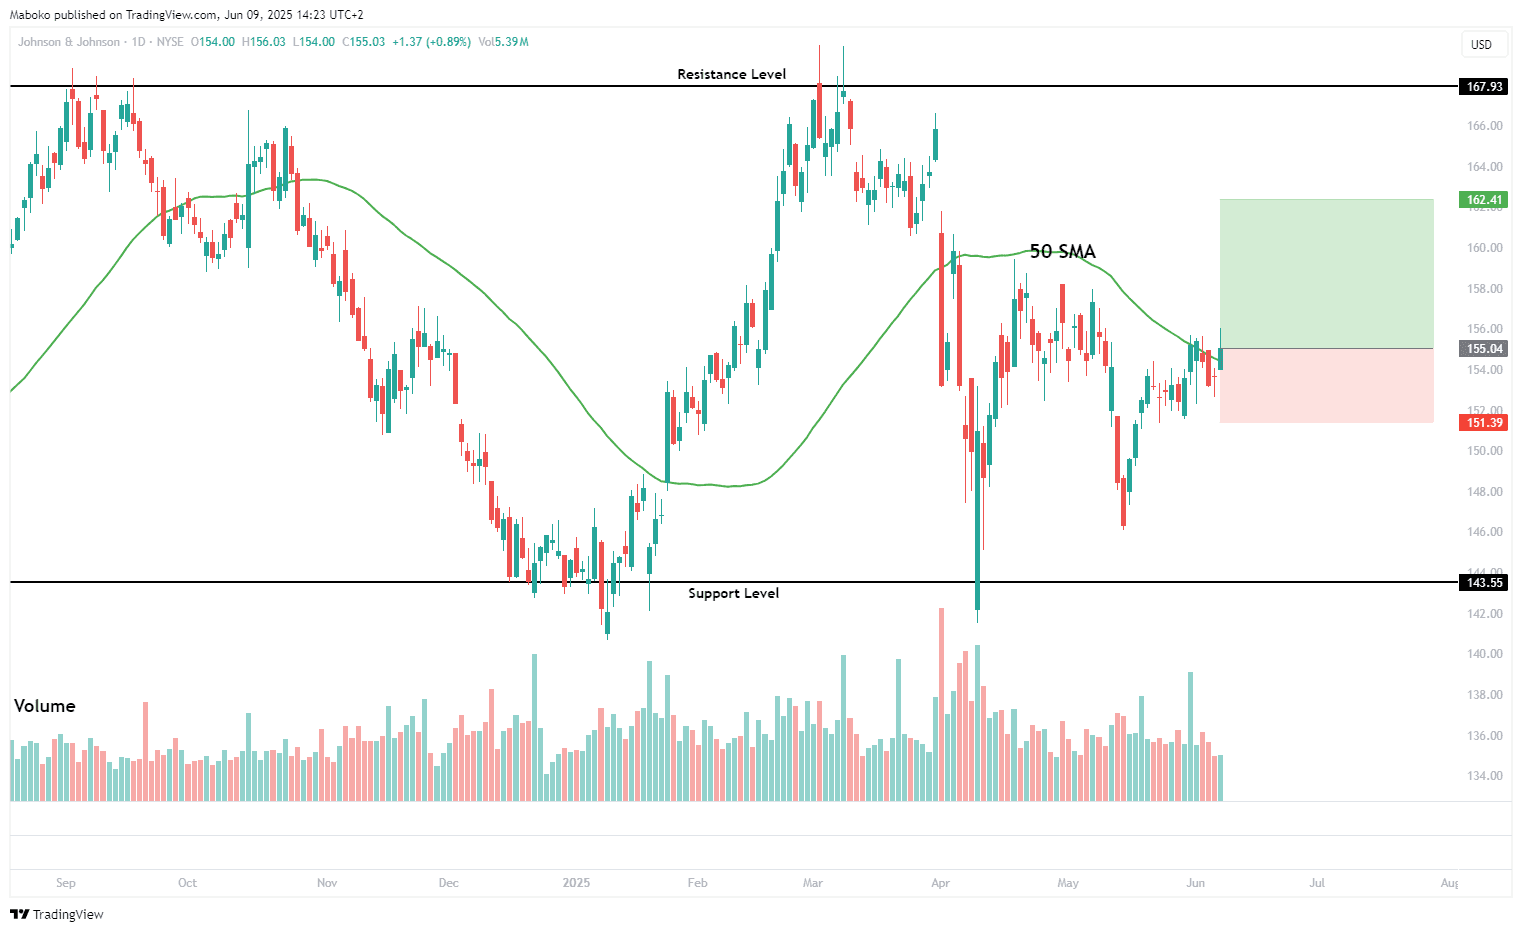
Johnson & Johnson (JNJ): Johnson & Johnson is a holding company that researches, develops, manufactures, and sells healthcare products.
The stock price has been trading within a defined range, bounded by resistance at $168 and support at $143. Recently, the price tested the support level and rebounded to close above the 50-day SMA (simple moving average), a level that has historically signalled continuation within the prevailing range. Notably, the trading volume has increased in 2025 compared to 2024, indicating growing investor interest and potentially reinforcing the likelihood of a sustained move, should a breakout occur.
A potential Buy/Long idea can be initiated, with the target set at $162.41 and the stop loss set at $151.39.
Consumer Discretionary
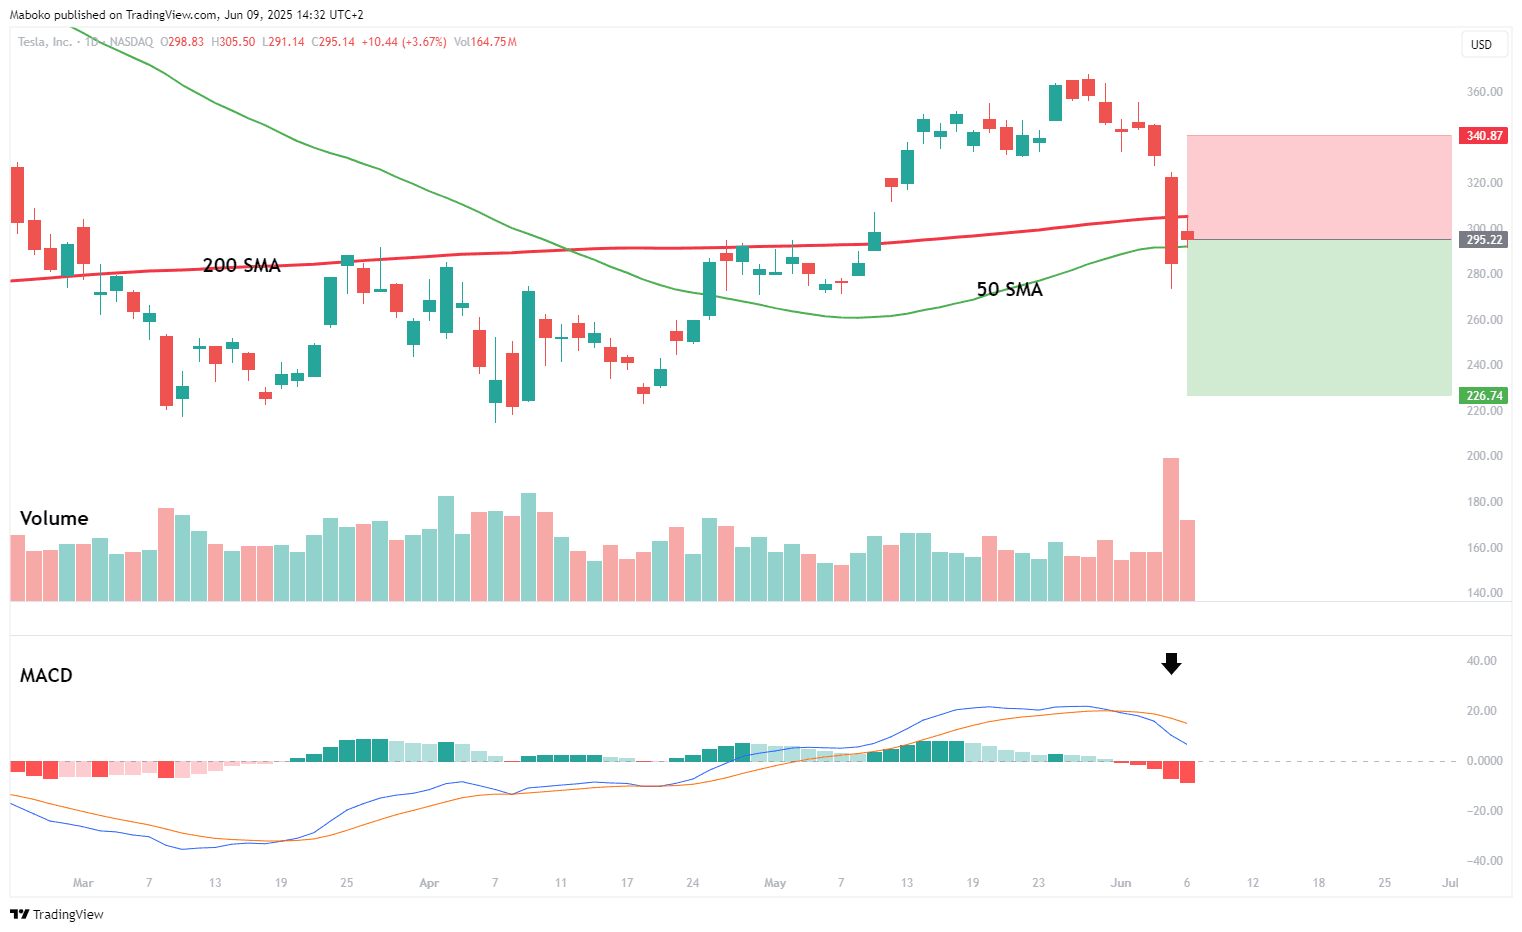
Tesla, Inc. (TSLA): Tesla, Inc. designs, develops, manufactures, and sells electric vehicles, energy generation, and storage systems.
On Thursday, the stock price closed below both the 50-day and 200-day SMA, a technically significant development that signals a potential shift in trend direction, with bears taking control. This bearish sentiment is further confirmed by a MACD (moving average convergence divergence) bearish cross under, indicating increasing downward momentum.
A speculative Sell/Short idea can be initiated, with the target set at $226.74 and the stop loss set at $340.87
Industrials
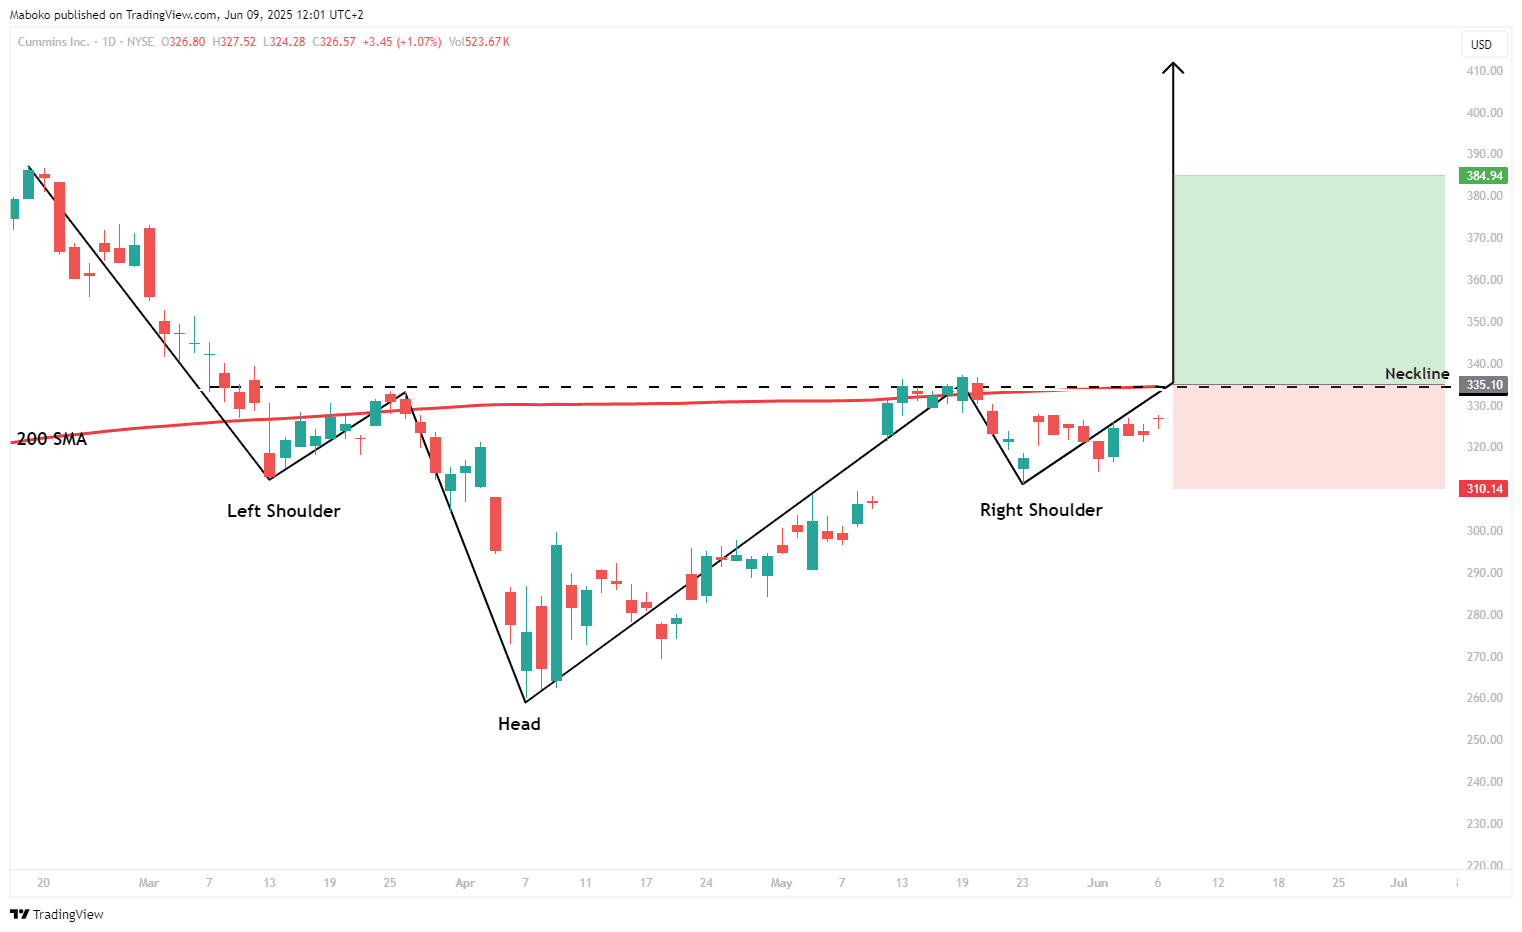
Cummins, Inc. (CMI): Cummins is in the design, manufacturing, and distribution of diesel, natural gas, electric, and hybrid powertrains and powertrain-related components.
An inverted head and shoulders pattern is forming, with the head at $260 and shoulders around $313. For the pattern to confirm a bullish reversal, the price must close above the neckline at $335. A breakout above this level would also place the price above the 200-day SMA, reinforcing the signal for a potential shift in trend direction and strengthening the case for renewed upward momentum.
A potential Buy/Long idea can be initiated, with the target set at $384.94 and the stop loss set at $310.14.
Disclaimer:
*Any opinions, views, analysis, or other information provided in this article is provided by BROKSTOCK SA trading as BROKSTOCK as general market commentary and should not be viewed as advice according to the FAIS Act of 2002. BROKSTOCK SA does not warrant the correctness, accuracy, timeliness, reliability, or completeness of any information provided by third parties. You must rely upon your judgement in all aspects of your investment decisions, and all decisions are made at your own risk. BROKSTOCK SA and any of its employees shall not be responsible for and will not accept any liability for any direct or indirect loss, including, without limitation, any loss of profit which may arise directly or indirectly from the use of the market commentary. The content contained within the article is subject to change at any time without notice. BROKSTOCK SA is an authorised financial services provider - FSP No. 51404. T&Cs and Disclaimers are applicable: https://brokstock.co.za/
** This article was prepared by BROKSTOCK analyst Maboko Seabi