
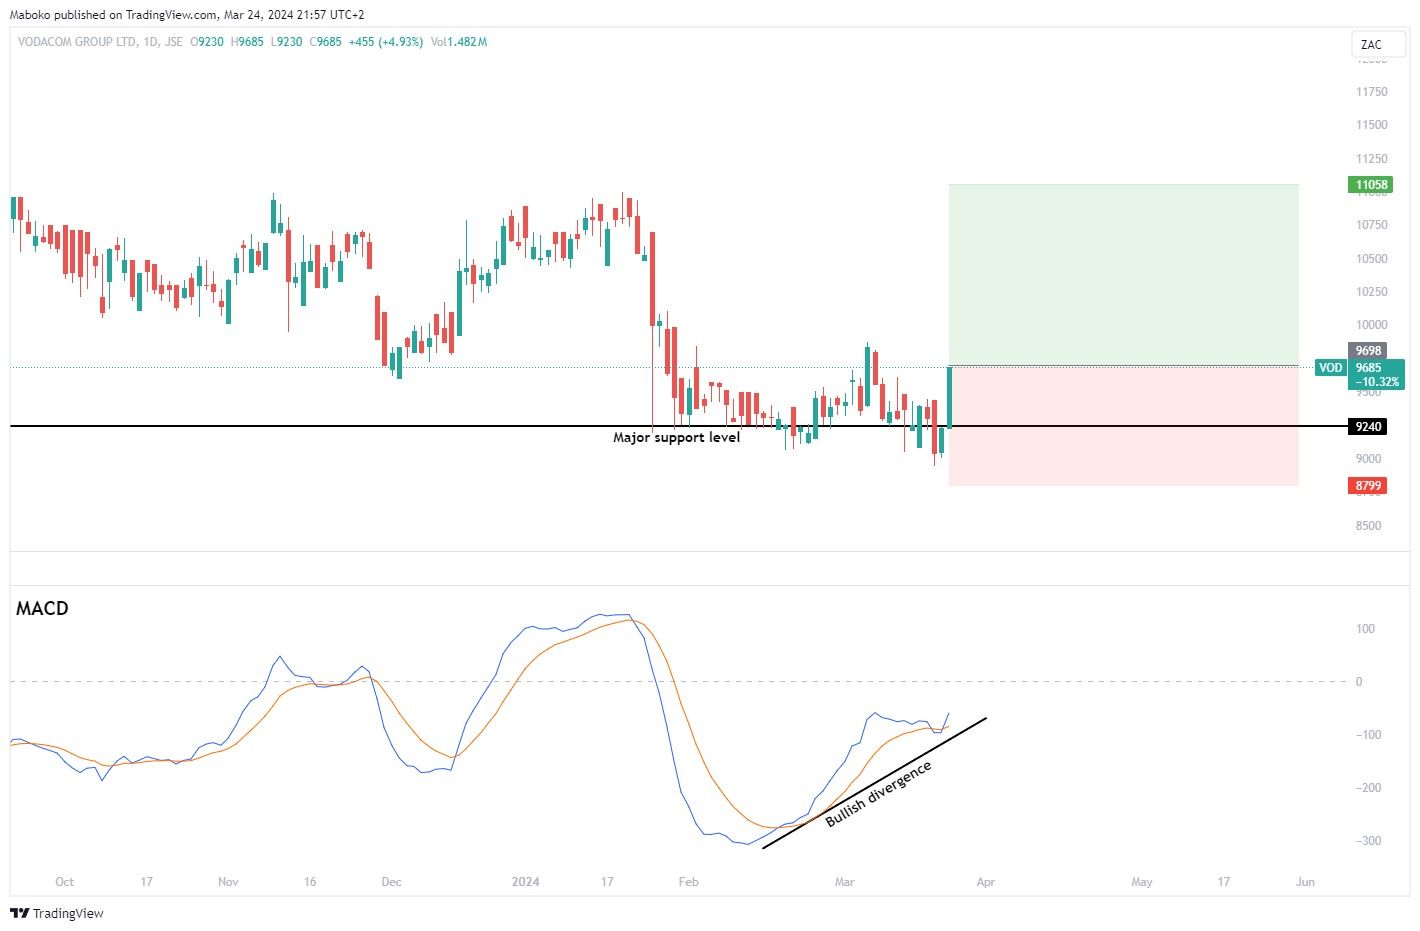
• Vodacom Group Ltd (VOD) | Telecoms: Vodacom Group Ltd. is in the business of communications products and services. It offers cellular networks in South Africa, Tanzania, Mozambique, Lesotho and the Democratic Republic of Congo.
The share price is currently trading at R96.90. The share price tested a major support level which has been previously tested in 2012 and 2020 respectively, making it the third time testing the support level. The MACD has made a bullish divergence, suggesting momentum to the downside is slowly fading and favouring upward momentum.
A buy/long idea can be initiated with a take profit (TP) set at R110.58 and the stop loss (SL) set at R87.99.
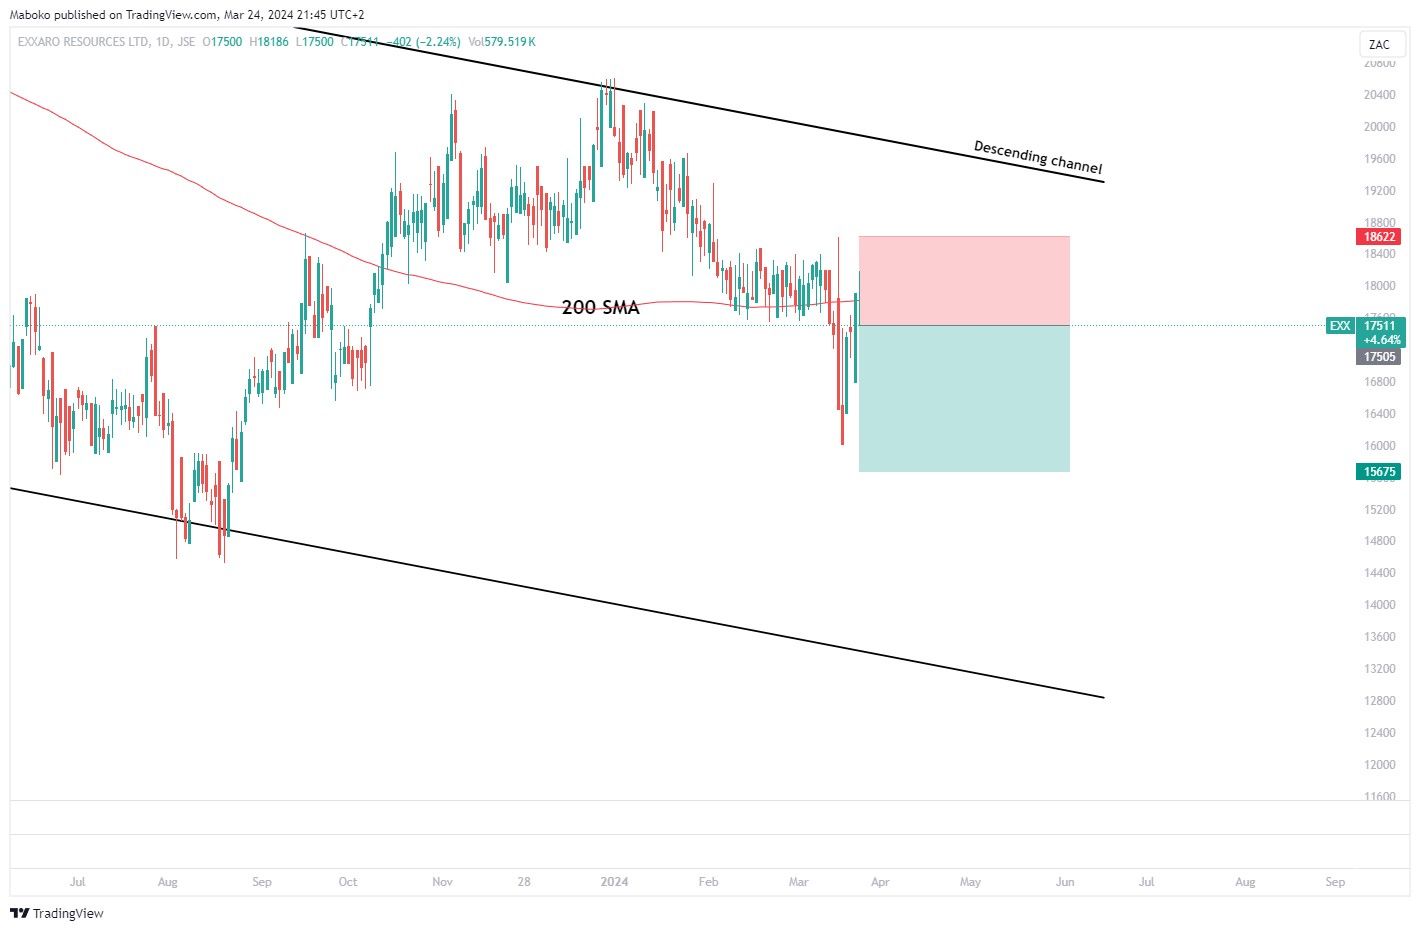
• Exxaro Resources Ltd (EXX) | Mining: Exxaro Resources Ltd. is in the
business of mineral exploration. It operates through Coal, Energy, Ferrous,
TiO2 and Alkali Chemicals.
We released a long idea in mid February 2024, it reached stop loss. The share price has been in a descending channel, having reached the top of the channel and making its way down to the low of the channel. The price is trading below the 200 day SMA, signalling that the bears are in charge of the trend.
A potential sell/short can be initiated with take profit (TP) set at R156.76 and stop loss (SL) is set at R186.22.
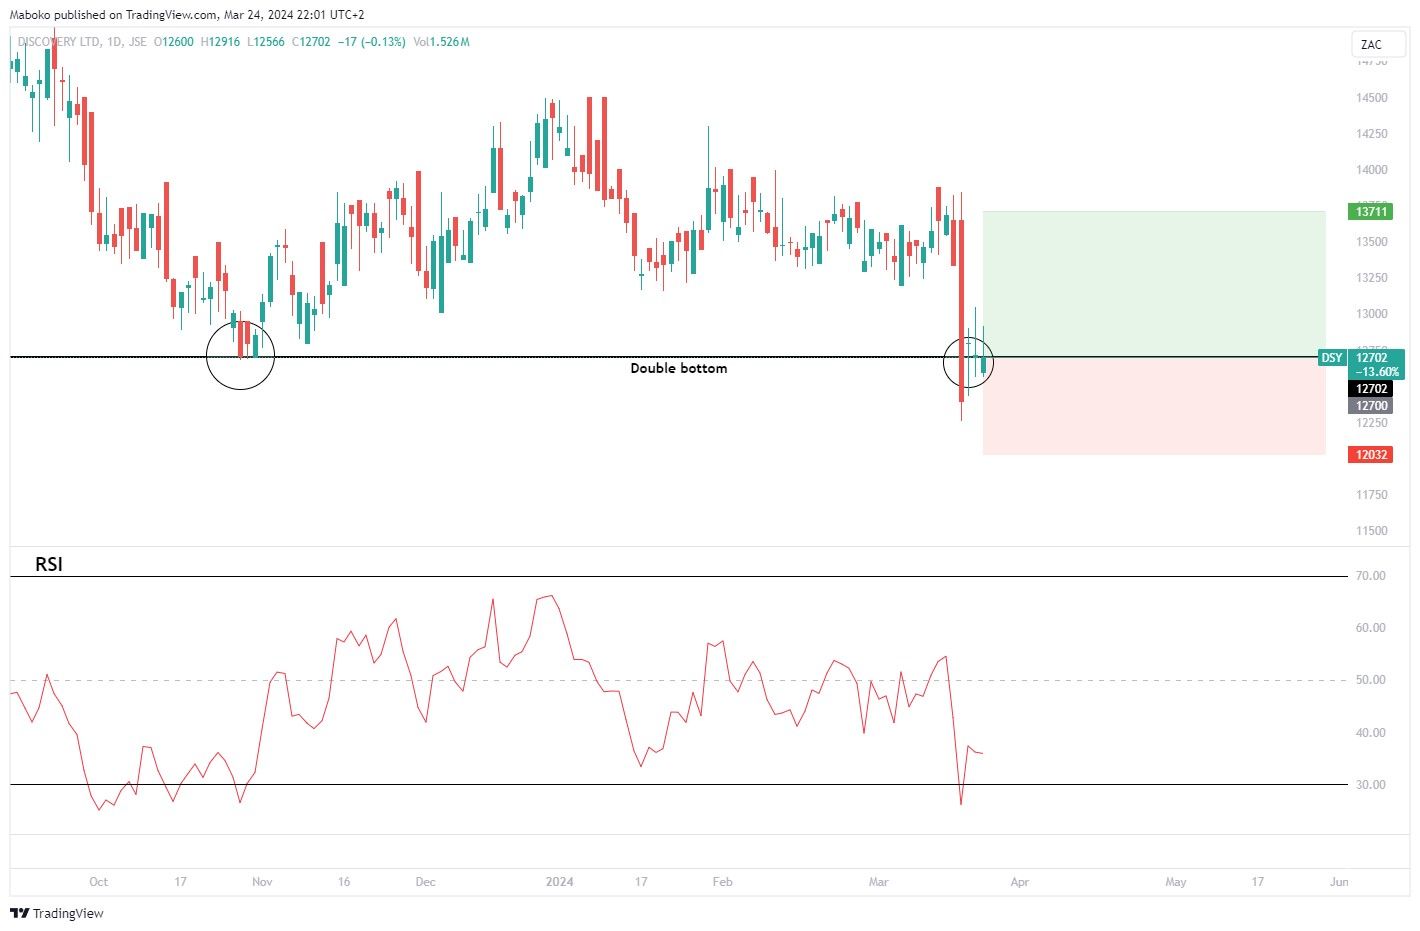
• Discovery Ltd (DSY) | Finance: Discovery Ltd. is in the business
of financial and insurance services. It operates through Health South Africa,
Life South Africa, Invest South Africa, Insure South Africa, Vitality South
Africa, Bank South Africa , Health United Kingdom and Life United Kingdom.
The share price is currently trading at R127.02, a potential double bottom is unfolding if the price holds above the support level at R127.00. The RSI has entered into oversold territory, suggesting momentum to the upside is applicable also considering that the price has historically moved up from the conditions present.
A buy/long can be initiated with a take profit (TP) set at R137.11 and stop loss (SL) set at R120.32.
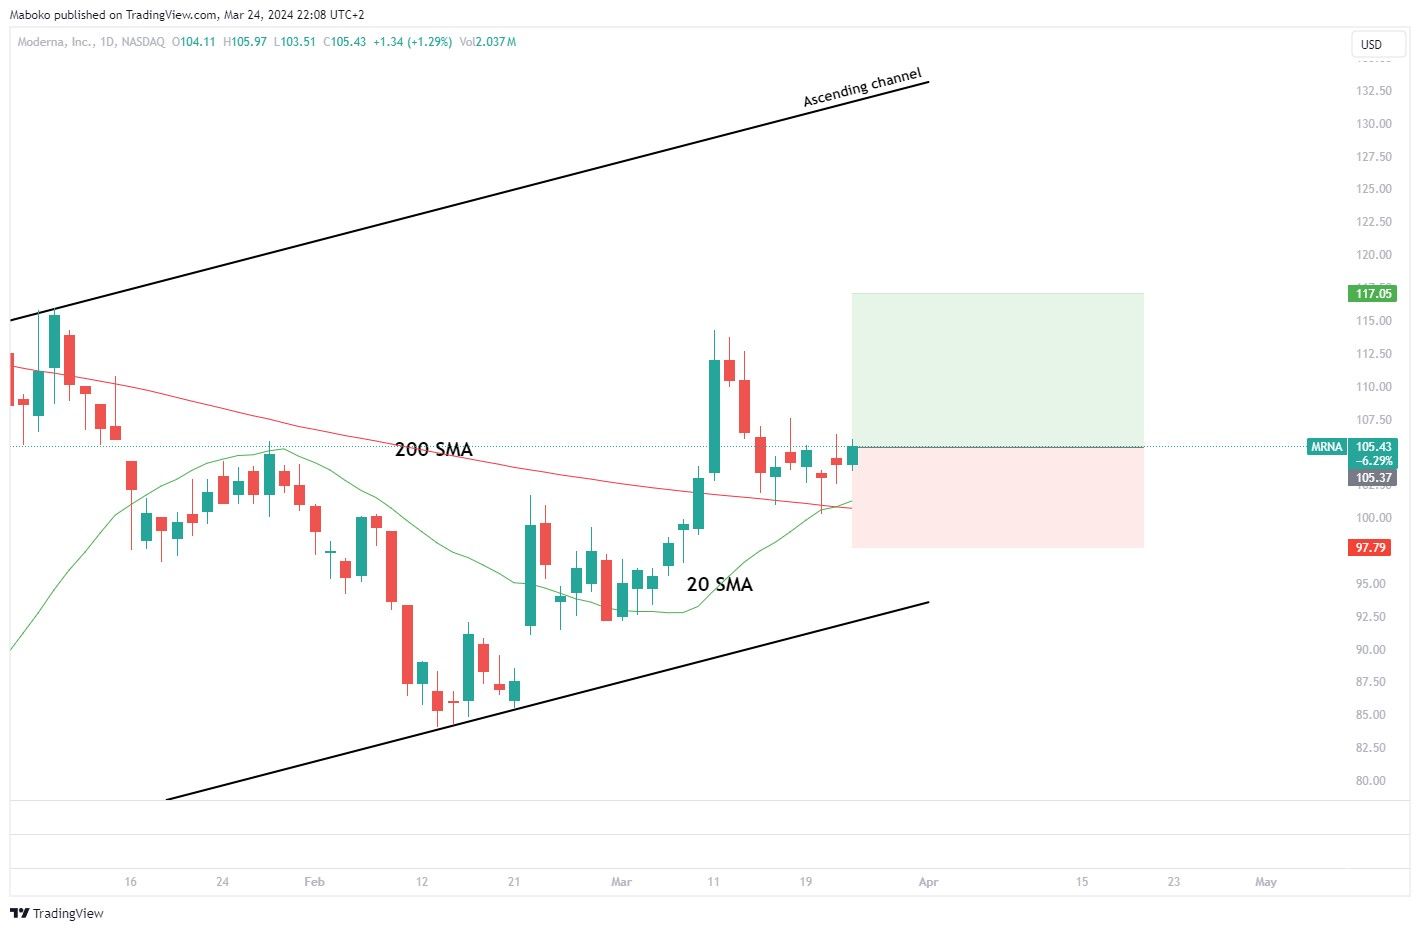
• Moderna, Inc (MRNA) | Health Technology: Moderna is in the business of development of transformative medicines based on messenger ribonucleic acid (mRNA). Its products include prophylactic vaccines, cancer vaccines, intratumoral immuno-oncology, localised regenerative therapeutics, systemic secreted therapeutics, and systemic intracellular therapeutics.
The share price is in an ascending channel, having tested the lower bound of the channel and making its way up. The 20-day SMA has crossed above the 200-day SMA and the share price trading above the 200- day SMA, suggesting that the bulls are in charge of the trend.
A buy/long idea can be initiated with a take profit (TP) set at $117.05 and the stop loss (SL) set at $97.79.
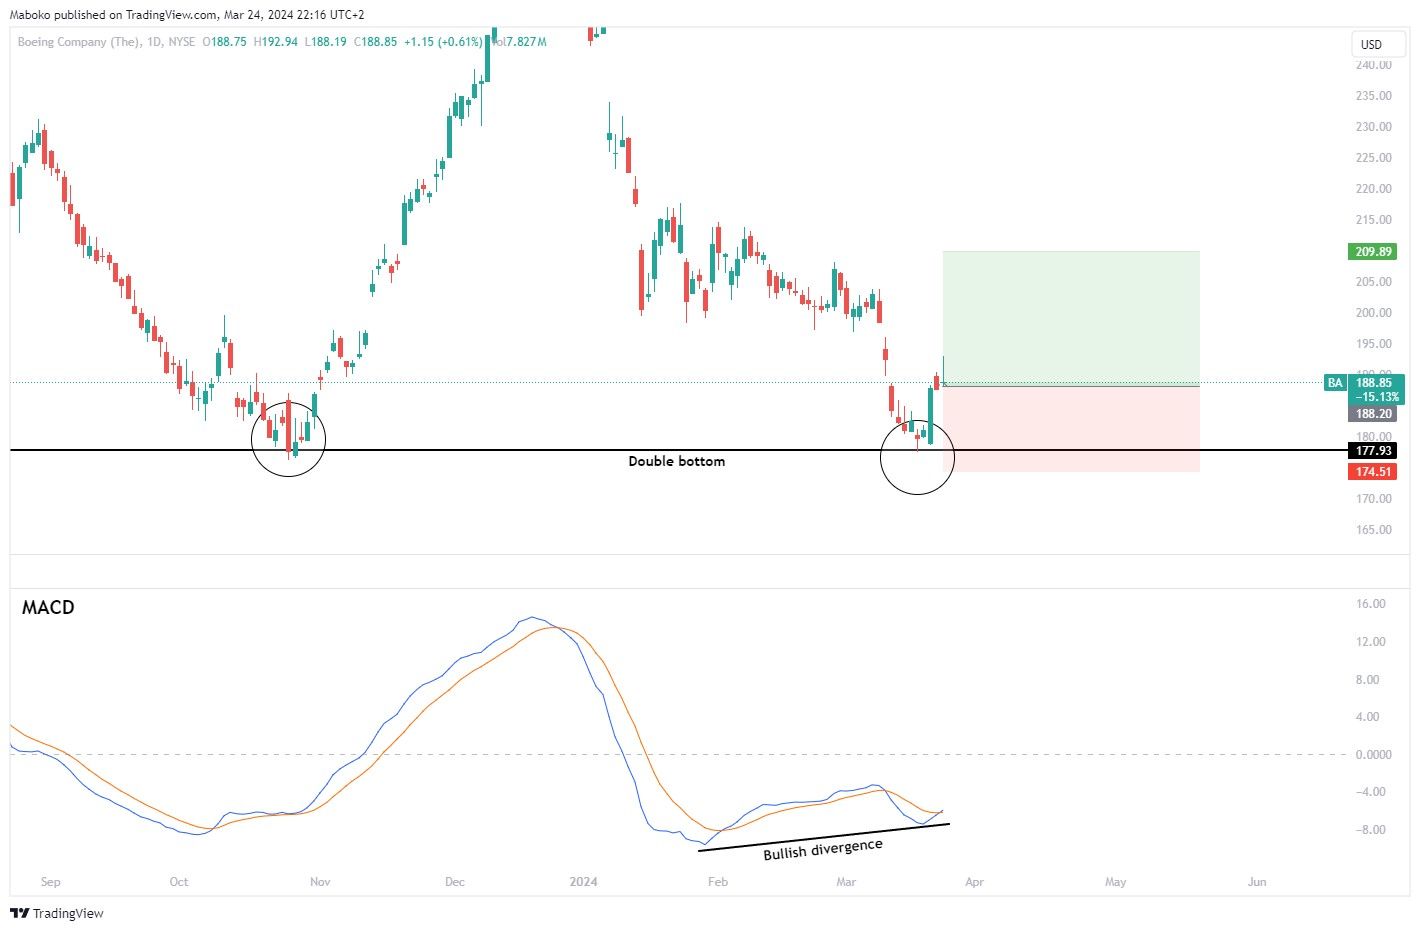
• The Boeing Co.(BA) | Electronic Technology: The Boeing Co. is an aerospace
company, which is in the manufacturing of commercial jetliners, defence, space
and security systems.
The share price is currently trading at $188.89. The price has tested the low of $177.93, creating a double bottom from the low of October 2023. The MACD has also signalled a bullish divergence, suggesting the momentum to the downside is fading and favouring upward momentum.
A potential buy/long can be initiated with take profit (TP) set at $209.89 and stop loss (SL) is set at $174.51.
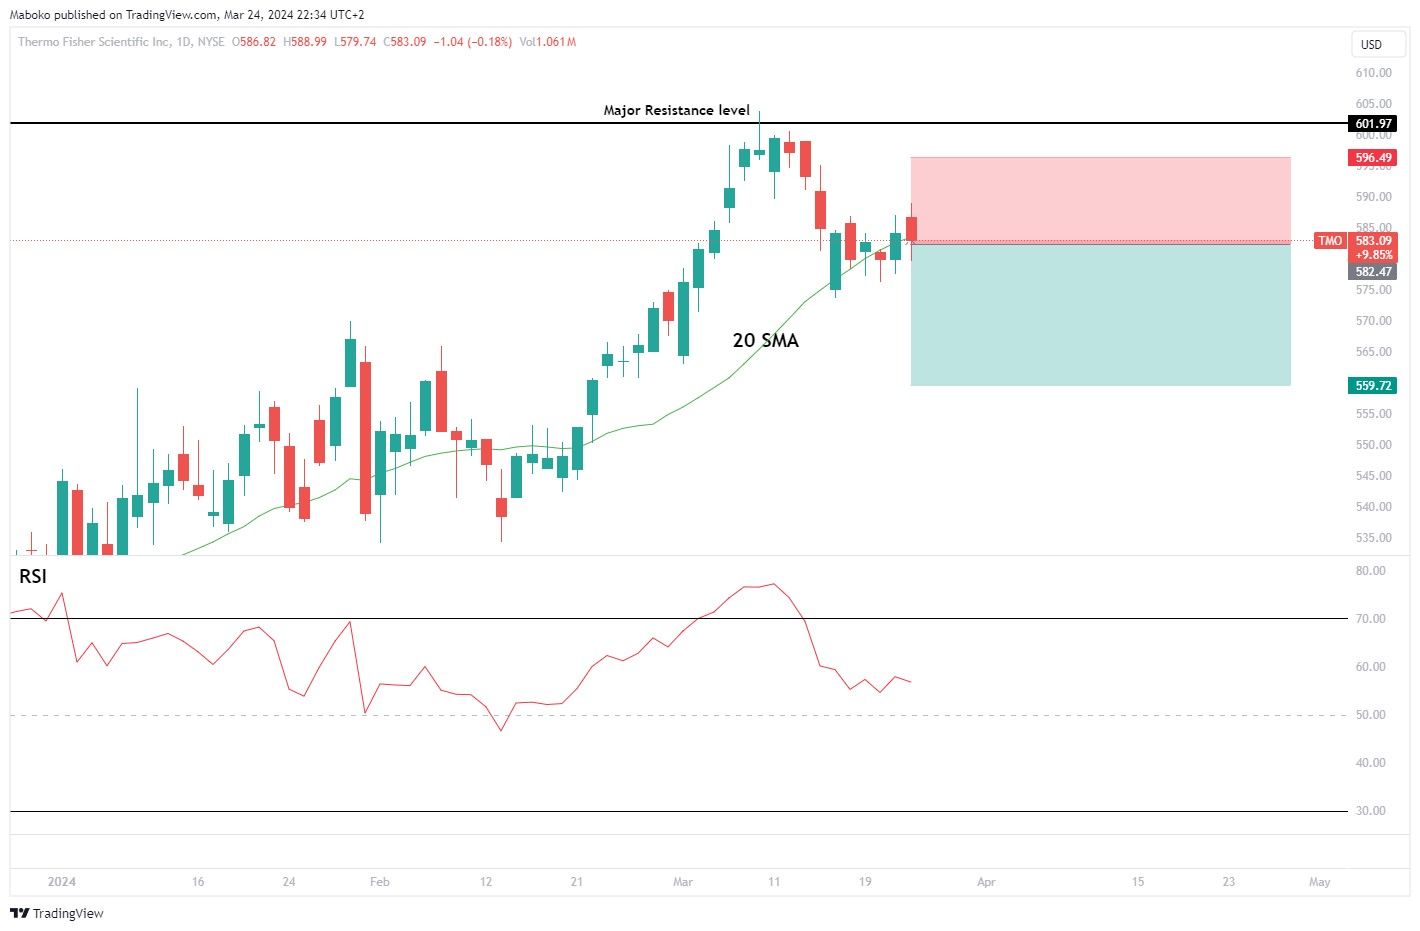
• Thermo Fisher Scientific, Inc (TMO) | Health Technology: Thermo Fisher Scientific is in
the provision of analytical instruments, equipment, reagents, software,
services for research, analysis, discovery, and diagnostics.
The share price has tested the resistance level at $601.97 and has continued moving down, the share has historically tested the resistance level four times since April 2022. The RSI crossed below out of oversold territory suggesting momentum to the downside is applicable.
A sell/short can be initiated with a take profit (TP) set at $559.72 and stop loss (SL) set at $596.49.
Disclaimer:
Any opinions, views, analysis or other information provided in this article is provided by BCS Markets SA trading as BROCKSTOCK as general market commentary and should not be viewed as advice according to the FAIS Act of 2002. BCS Markets SA does not warrant the correctness, accuracy, timeliness, reliability or completeness of any information provided by third parties. You must rely upon your judgement in all aspects of your investment decisions and all decisions are made at your own risk. BCS Markets SA and any of its employees shall not be responsible for and will not accept any liability for any direct or indirect loss including without limitation any loss of profit which may arise directly or indirectly from use of the market commentary. The content contained within the article is subject to change at any time without notice. BCS Markets SA is an authorized financial services provider FSP No. 51404.