What Is a Head and Shoulders Chart Pattern in Technical Analysis?
Technical analysis is essential for predicting price changes in the realm of trade and financial markets. One such widely recognised and popular chart pattern is the Head and Shoulders pattern. This pattern looks just like a head with two shoulders on either side, as its name suggests. In this article, you will be walked through the ins and outs of the Head and Shoulders pattern, and know how it can be utilised effectively in trading strategies.
What does the Head and Shoulders Pattern Mean?
The Head and Shoulders pattern is a reliable and potent trend reversal pattern observed on price charts. It suggests a potential reversal of the current trend, from one that is bullish to one that is bearish. The left shoulder, the head, and the right shoulder make up the 3 separate components of the pattern. It is essential to identify these components accurately to confirm the pattern's presence and its implications on the price movement.
What are the Elements of the Head and Shoulders Pattern?
Let's delve deeper into understanding the elements of the Head and Shoulders pattern:
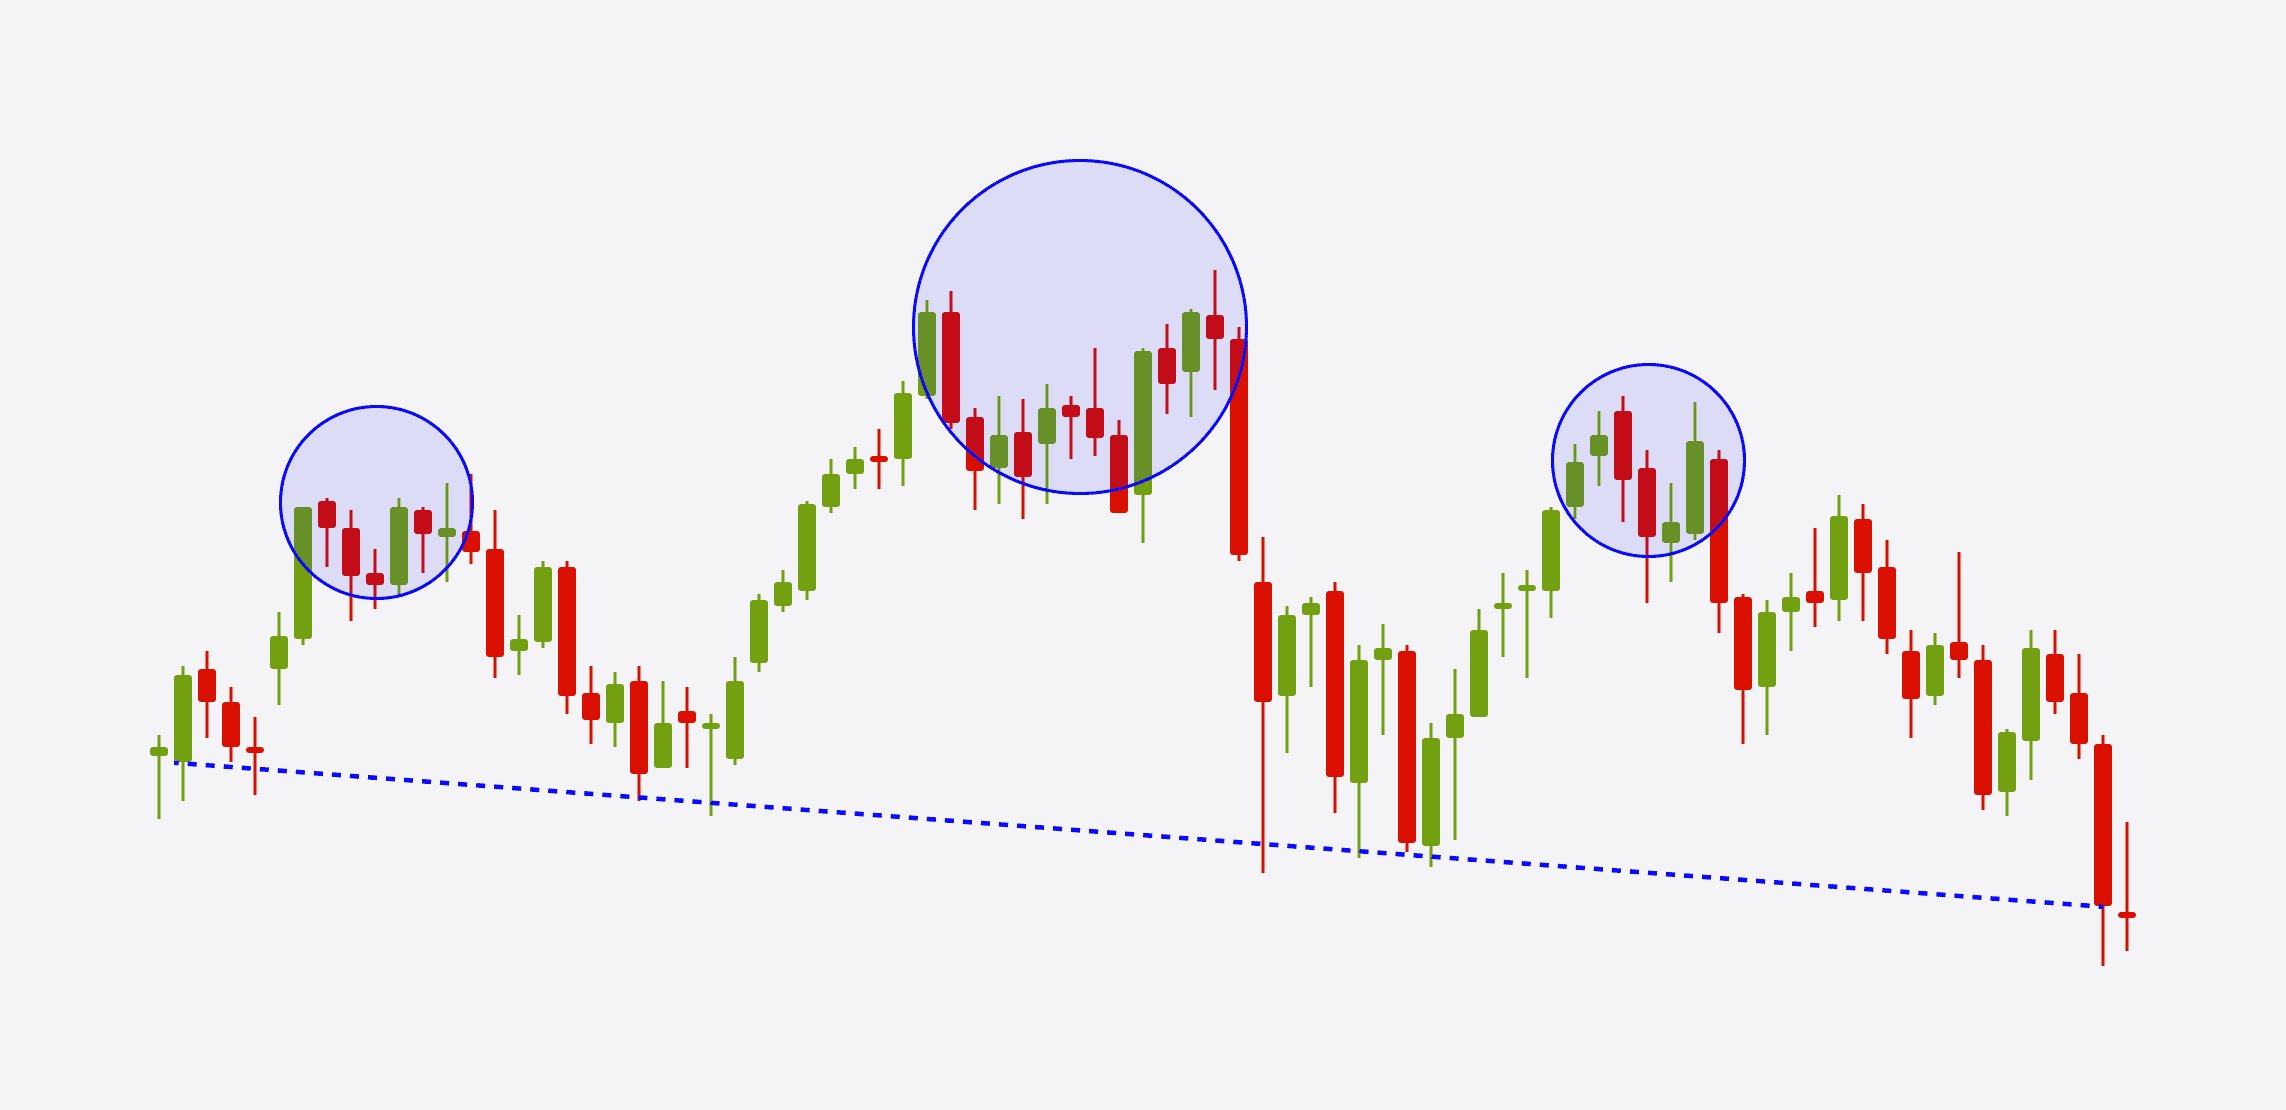
The Left Shoulder: The pattern typically begins with the left shoulder, which is formed when the price reaches a peak during an upward trend, followed by a minor decline. Traders may perceive this as a temporary correction before the uptrend resumes.
The Head: The head is the central and highest point in the pattern. It occurs when the price reaches its highest peak, surpassing the heights of both the left shoulder and the subsequent right shoulder. As the price retraces after reaching this peak, it often results in increased selling pressure, indicating a potential trend reversal.
The Right Shoulder: Following the formation of the head, there is another minor peak known as the right shoulder. The price rises again but usually fails to reach the level of the head. The right shoulder is considered the final warning sign of an impending trend reversal.
What are the Benefits of the Head and Shoulders Pattern?
Here are the benefits of the Head and Shoulders Pattern:
Reliable Reversal Signal: The Head and Shoulders pattern is considered one of the most steadfast and reliable trend reversal patterns in technical analysis. Traders often use this pattern to identify potential trend reversals in both forex and stock markets.
Defined Risk and Profit Targets: One of the main advantages of the Head and Shoulders pattern is that it provides traders with clearly defined areas to set risk levels and profit targets. The neckline serves as a critical support or resistance level, allowing traders to establish stop-loss and take-profit orders with greater precision.
Versatility: The pattern can be applied to various timeframes and different markets, making it a versatile tool for traders. Whether analysing short-term forex charts or long-term stock charts, the Head and Shoulders pattern remains applicable.
Clear Entry and Exit Points: Traders can use the confirmation of the pattern's break below the neckline or above the neckline to enter or exit positions. This clarity in entry and exit points helps traders make more informed decisions.
What are the Drawbacks of the Head and Shoulders Pattern?
Here are the drawbacks of the Head and Shoulders Pattern:
Identification Complexity: The Head and Shoulders pattern may not be easy to identify, especially for novice traders. Accurate recognition of the pattern requires experience and technical analysis skills, which can pose a challenge for less-experienced traders.
False Signals: Although the pattern is considered reliable, it is not 100% accurate. Traders need to exercise caution as false signals may occur, leading to potential losses if trades are initiated prematurely.
Large Stop Loss Distances: Depending on the timeframe and market being traded, the distance between the entry point and stop-loss level can sometimes be significant. This can result in larger potential losses if the trade does not go as anticipated.
Missed Opportunities: Novice traders or those not familiar with pattern recognition may miss potential Head and Shoulders patterns, leading to missed trading opportunities.
How to Use the Head and Shoulders Pattern in Trading?
Traders can effectively use the Head and Shoulders pattern in their trading strategies by following these steps:
Identify the Pattern: Spot the three peaks on the chart - the left shoulder, head, and right shoulder - forming the characteristic "head and shoulders" pattern. The head should be the highest peak among the three, while the shoulders should ideally be symmetrical in price level, though asymmetrical shoulders are also accepted as long as the difference is not significant.
Determine the Trend: The Head and Shoulders pattern is a reversal pattern. Traders should look for this pattern at the end of an uptrend, signaling a potential trend reversal from bullish to bearish.
Draw the Neckline: Connect the bottoms of the two shoulders with a trend line, known as the neckline. This line serves as a crucial support level for the pattern and its break acts as a confirmation for the pattern.
Confirmation and Entry: Wait for the price to break below the neckline after the formation of the right shoulder. This break confirms the Head and Shoulders pattern and provides an entry signal for traders to consider opening a short position.
Setting Targets and Stops: Use the height of the pattern to project potential price targets. Typically, traders set a profit target by measuring the distance from the neckline to the top of the head and projecting it downward from the breakout point. Also, the prior swing high can serve as a stop-loss level for the trade.
Risk Management: Implement proper risk management techniques to protect capital. Traders should consider position sizing and stop-loss placement to manage potential losses.
The Inverse Head and Shoulders Pattern
The Inverse Head and Shoulders pattern is the bullish counterpart of the Head and Shoulders pattern. Traders can use the Inverse Head and Shoulders pattern to identify potential bullish trend reversals. Here's how it works:
Pattern Identification: The Inverse Head and Shoulders pattern also consists of three peaks on the chart - the left shoulder, head, and right shoulder. However, in this pattern, the head is the lowest point, and the shoulders are at higher price levels.
Spotting the Downtrend: The Inverse Head and Shoulders pattern occurs at the end of a downtrend. It indicates that the sellers are losing momentum and the trend is potentially changing from bearish to bullish.
Drawing the Neckline: Connect the highs of the two shoulders with a trend line, forming the neckline. This line acts as a crucial resistance level for the pattern, and its break confirms the Inverse Head and Shoulders pattern.
Confirmation and Entry: Wait for the price to break above the neckline after the formation of the right shoulder. This break confirms the pattern and provides an entry signal for traders to consider opening a long position.
Setting Targets and Stops: Similar to the Head and Shoulders pattern, traders can use the height of the pattern to project potential price targets for the bullish move. Also, the prior swing low can serve as a Stop Loss level for the trade.
Risk Management: Always employ proper risk management techniques to protect against potential losses. Traders should consider position sizing and Stop Loss placement based on their risk tolerance.
Bottom Line and Key Takeaways
The Head and Shoulders pattern is a valuable tool in a trader's arsenal, providing early signals of potential trend reversals. It offers reliable reversal signals, clear risk and profit targets, and versatility across different markets and timeframes. However, it is crucial to remain aware of complexity in identification, potential false signals, large stop-loss distances, and the risk of missing opportunities. Traders should approach trading this pattern with a thorough understanding of its strengths and weaknesses and complement it with other technical indicators and risk management strategies for more robust trading decisions.
By understanding and effectively using the Head and Shoulders pattern and its inverse counterpart, traders can make more informed trading decisions and potentially capitalise on trend reversals in the financial markets.
FAQ
1. Are there other variations of the Head and Shoulders pattern?
Yes, there is another variation of the Head and Shoulders pattern. It's called the "Head and Shoulders Bottom" and represents a bullish reversal.
2. Can the Head and Shoulders pattern be used in conjunction with other technical indicators?
Absolutely! Combining the Head and Shoulders pattern with other technical indicators like Moving Averages or Relative Strength Index (RSI) can provide additional confirmation and improve the accuracy of your trading signals.
3. What timeframes are best suited for identifying the Head and Shoulders pattern?
The Head and Shoulders pattern can be spotted on various timeframes, from intraday charts to daily and weekly charts. However, it is essential to note that patterns on higher timeframes tend to carry more significance.
4. Is the Head and Shoulders pattern equally effective in all financial markets?
While the Head and Shoulders pattern is most widely utilised in the stock market, it may also be used in FX, commodities, and cryptocurrency. Its effectiveness may vary slightly depending on the market's characteristics.
5. Should I solely rely on the Head and Shoulders pattern for my trading decisions?
No, it is advisable to use the Head and Shoulders pattern as part of a comprehensive trading strategy. Incorporate it with other technical and fundamental analysis tools to make well-informed trading decisions.
© 2026 BROKSTOCK SA (PTY) LTD.
BROKSTOCK SA (PTY) LTD is an authorised Financial Service Provider and is regulated by the South African Financial Sector Conduct Authority (FSP No.51404). BROKSTOCK SA (PTY) LTD Proprietary Limited trading as BROKSTOCK. BROKSTOCK SA (PTY) LTD t/a BROKSTOCK acts solely as an intermediary in terms of the FAIS Act, rendering only an intermediary service (i.e., no market making is conducted by BROKSTOCK SA (PTY) LTD t/a BROKSTOCK) in relation to derivative products (CFDs) offered by the liquidity providers. Therefore, BROKSTOCK SA (PTY) LTD t/a BROKSTOCK does not act as the principal or the counterparty to any of its transactions.
The materials on this website (the “Site”) are intended for informational purposes only. Use of and access to the Site and the information, materials, services, and other content available on or through the Site (“Content”) are subject to the laws of South Africa.
Risk notice Margin trading in financial instruments carries a high level of risk, and may not be suitable for all users. It is essential to understand that investing in financial instruments requires extensive knowledge and significant experience in the investment field, as well as an understanding of the nature and complexity of financial instruments, and the ability to determine the volume of investment and assess the associated risks. BROKSTOCK SA (PTY) LTD pays attention to the fact that quotes, charts and conversion rates, prices, analytic indicators and other data presented on this website may not correspond to quotes on trading platforms and are not necessarily real-time nor accurate. The delay of the data in relation to real-time is equal to 15 minutes but is not limited. This indicates that prices may differ from actual prices in the relevant market, and are not suitable for trading purposes. Before deciding to trade the products offered by BROKSTOCK SA (PTY) LTD, a user should carefully consider his objectives, financial position, needs and level of experience. The Content is for informational purposes only and it should not construe any such information or other material as legal, tax, investment, financial, or other advice. BROKSTOCK SA (PTY) LTD will not accept any liability for loss or damage as a result of reliance on the information contained within this Site including data, quotes, conversion rates, etc.
Third party content BROKSTOCK SA (PTY) LTD may provide materials produced by third parties or links to other websites. Such materials and websites are provided by third parties and are not under BROKSTOCK SA (PTY) LTD's direct control. In exchange for using the Site, the user agrees not to hold BROKSTOCK SA (PTY) LTD, its affiliates or any third party service provider liable for any possible claim for damages arising from any decision user makes based on information or other Content made available to the user through the Site.
Limitation of liability The user’s exclusive remedy for dissatisfaction with the Site and Content is to discontinue using the Site and Content. BROKSTOCK SA (PTY) LTD is not liable for any direct, indirect, incidental, consequential, special or punitive damages. Working with BROKSTOCK SA (PTY) LTD you are trading share CFDs. When trading CFDs on shares you do not own the underlying asset. Share CFDs are complex instruments and come with a high risk of losing money rapidly due to leverage. A high percentage of retail traders accounts lose money when trading CFDs with their provider. All rights reserved. Any use of Site materials without permission is prohibited.