Red Candlestick: Definition, What It Tells You, How to Use It
What Does a Red Candlestick Mean?
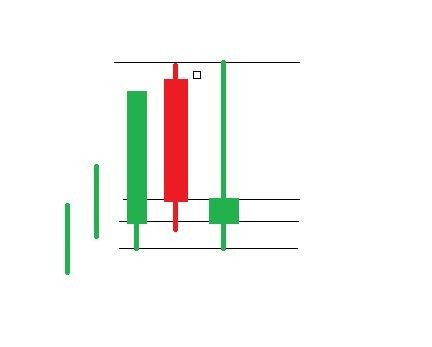
A Red Candlestick in financial analysis refers to a specific type of candlestick chart pattern that indicates a downtrend in the security’s price. It signifies that the security's closing price is less than both its opening and preceding closing prices. The candlestick is composed of various components, including the shadows representing the high and low points of the time, and the true body representing the open and close.
Explaining a Red Candlestick
A Red Candlestick brings essential information about the movement of the price during a specific period of time. It provides details about the open, high, low, and close prices. The length of the candlestick indicates the magnitude of the movement of the price, and longer candlesticks represent larger price changes.
The colour of a Red Candlestick signifies that the closing price is less than both the open and the previous closing price. It can appear filled or hollow, depending on whether the close is higher or lower than the open, respectively. The filled Red Candlestick indicates a clear and strong downtrend, while the hollow Red Candlestick suggests a close above the open but below the previous close.
How Can a Red Candlestick Be Used?
Traders and technical analysts can utilise Red Candlesticks in various ways:
Trend Identification: Red Candlesticks are often associated with downtrends and can be used to identify and confirm the presence of a bearish trend. A series of consecutive Red Candlesticks suggests a sustained downward price movement.
Reversal Signals: Red Candlesticks, particularly those with long real bodies, can indicate potential reversal points in a market. When a prolonged uptrend is followed by a Red Candlestick, it may suggest a weakening of the bullish momentum and the possibility of a trend reversal.
Resistance and Support Levels: Red Candlesticks can help identify resistance levels, which are price levels where selling pressure becomes significant. If Red Candlesticks consistently form near a specific price level, it indicates a strong resistance zone. Traders can use this information to plan their entry and exit points.
Confirmation with Other Indicators: Red Candlesticks are often utilised in conjunction with other technical analysis tools and indicators in order to strengthen the analysis. For example, traders may look for overbought conditions using oscillators like the Relative Strength Index (RSI) in combination with Red Candlesticks to anticipate potential price reversals.
It is important to note that while Red Candlesticks bring beneficial insights, they should not be used in isolation for trading decisions. Traders should consider other factors such as volume, market conditions, and additional technical indicators to validate the analysis.
What are the Advantages of a Red Candlestick?
Here are some advantages of a Red Candlestick:
Bearish Signal: A Red Candlestick indicates a bearish sentiment in the market, suggesting that sellers have dominated the trading activity during the period. It signifies a potential downward trend or a continuation of a downtrend in the security's price.
Visual Representation: Candlestick charts, including Red Candlesticks, offer a visual representation of price movements, making it easier for traders to interpret and analyse historical price patterns. The colour-coded nature of candlesticks helps highlight the difference between the prices at the opening and closing, aiding in the identification of market trends.
What are the Disadvantages of a Red Candlestick?
While candlestick charts are widely utilised by traders to analyse price movements and identify trends, it's important to consider the disadvantages associated with Red
Candlesticks:
Bearish Signal: A red filled candlestick indicates a strong downtrend and suggests that sellers have dominated the market during the period. This can be a disadvantage for investors or traders who hold long positions in the security as it signifies a potential decline in value.
Limited Information: Red Candlesticks provide limited information about the overall market sentiment and may not reveal the full context of the price movement. To make informed decisions, it is often necessary to consider other technical tools, chart patterns, or additional candlestick formations.
Ignoring Prior Close: Some charting platforms can’t take into account the prior close when drawing candlesticks. This can affect the accuracy and interpretation of the candlestick patterns, including Red Candlesticks. It's important to ensure that the charting platform used considers the previous close to accurately represent the market data.
Despite these disadvantages, Red Candlesticks can still bring beneficial insights into market movements when utilised in conjunction with other technical analysis indicators and tools. Traders should consider a comprehensive approach to analysing candlestick patterns and incorporate additional factors before making trading decisions.
Bottom Line and Key Takeaways
Red Candlesticks represent a significant chart pattern that indicates a downtrend in the price of a security. They serve as visual representations of price movements and can be used by traders to identify trends, potential reversals, and support/resistance levels in the market. However, it is essential to use Red Candlesticks alongside other forms of technical analysis to confirm trends and consider additional factors that may impact the market.
FAQ
1. Are Red Candlesticks always bearish?
Red Candlesticks generally indicate a bearish or downtrend market sentiment. However, it is important to consider the context and other factors before making definitive conclusions. Red Candlesticks alone may not provide a comprehensive view of the market.
2. Can Red Candlesticks be used in isolation for trading decisions?
It is not recommended to rely solely on Red Candlesticks for trading decisions. Using Red Candlesticks in conjunction with other technical analysis tools, such as chart patterns, indicators, and volume analysis, can enhance the accuracy of predictions and validate market trends.
3. Are there any other commonly used candlestick colours?
Yes, candlestick charts often use different colours to represent various price movements. Besides red, common colours include black, green, and white. Each colour conveys different meanings based on the relationship between the open, close, and previous close prices.
© 2026 BROKSTOCK SA (PTY) LTD.
BROKSTOCK SA (PTY) LTD is an authorised Financial Service Provider and is regulated by the South African Financial Sector Conduct Authority (FSP No.51404). BROKSTOCK SA (PTY) LTD Proprietary Limited trading as BROKSTOCK. BROKSTOCK SA (PTY) LTD t/a BROKSTOCK acts solely as an intermediary in terms of the FAIS Act, rendering only an intermediary service (i.e., no market making is conducted by BROKSTOCK SA (PTY) LTD t/a BROKSTOCK) in relation to derivative products (CFDs) offered by the liquidity providers. Therefore, BROKSTOCK SA (PTY) LTD t/a BROKSTOCK does not act as the principal or the counterparty to any of its transactions.
The materials on this website (the “Site”) are intended for informational purposes only. Use of and access to the Site and the information, materials, services, and other content available on or through the Site (“Content”) are subject to the laws of South Africa.
Risk notice Margin trading in financial instruments carries a high level of risk, and may not be suitable for all users. It is essential to understand that investing in financial instruments requires extensive knowledge and significant experience in the investment field, as well as an understanding of the nature and complexity of financial instruments, and the ability to determine the volume of investment and assess the associated risks. BROKSTOCK SA (PTY) LTD pays attention to the fact that quotes, charts and conversion rates, prices, analytic indicators and other data presented on this website may not correspond to quotes on trading platforms and are not necessarily real-time nor accurate. The delay of the data in relation to real-time is equal to 15 minutes but is not limited. This indicates that prices may differ from actual prices in the relevant market, and are not suitable for trading purposes. Before deciding to trade the products offered by BROKSTOCK SA (PTY) LTD, a user should carefully consider his objectives, financial position, needs and level of experience. The Content is for informational purposes only and it should not construe any such information or other material as legal, tax, investment, financial, or other advice. BROKSTOCK SA (PTY) LTD will not accept any liability for loss or damage as a result of reliance on the information contained within this Site including data, quotes, conversion rates, etc.
Third party content BROKSTOCK SA (PTY) LTD may provide materials produced by third parties or links to other websites. Such materials and websites are provided by third parties and are not under BROKSTOCK SA (PTY) LTD's direct control. In exchange for using the Site, the user agrees not to hold BROKSTOCK SA (PTY) LTD, its affiliates or any third party service provider liable for any possible claim for damages arising from any decision user makes based on information or other Content made available to the user through the Site.
Limitation of liability The user’s exclusive remedy for dissatisfaction with the Site and Content is to discontinue using the Site and Content. BROKSTOCK SA (PTY) LTD is not liable for any direct, indirect, incidental, consequential, special or punitive damages. Working with BROKSTOCK SA (PTY) LTD you are trading share CFDs. When trading CFDs on shares you do not own the underlying asset. Share CFDs are complex instruments and come with a high risk of losing money rapidly due to leverage. A high percentage of retail traders accounts lose money when trading CFDs with their provider. All rights reserved. Any use of Site materials without permission is prohibited.