


JSE & NYSE Shares Analysis 9 - 13 November 2026

JSE SHARES
Financials
CPI — Capitec Ltd.
South African retail bank focused on low-cost transactional banking, savings, and unsecured credit.
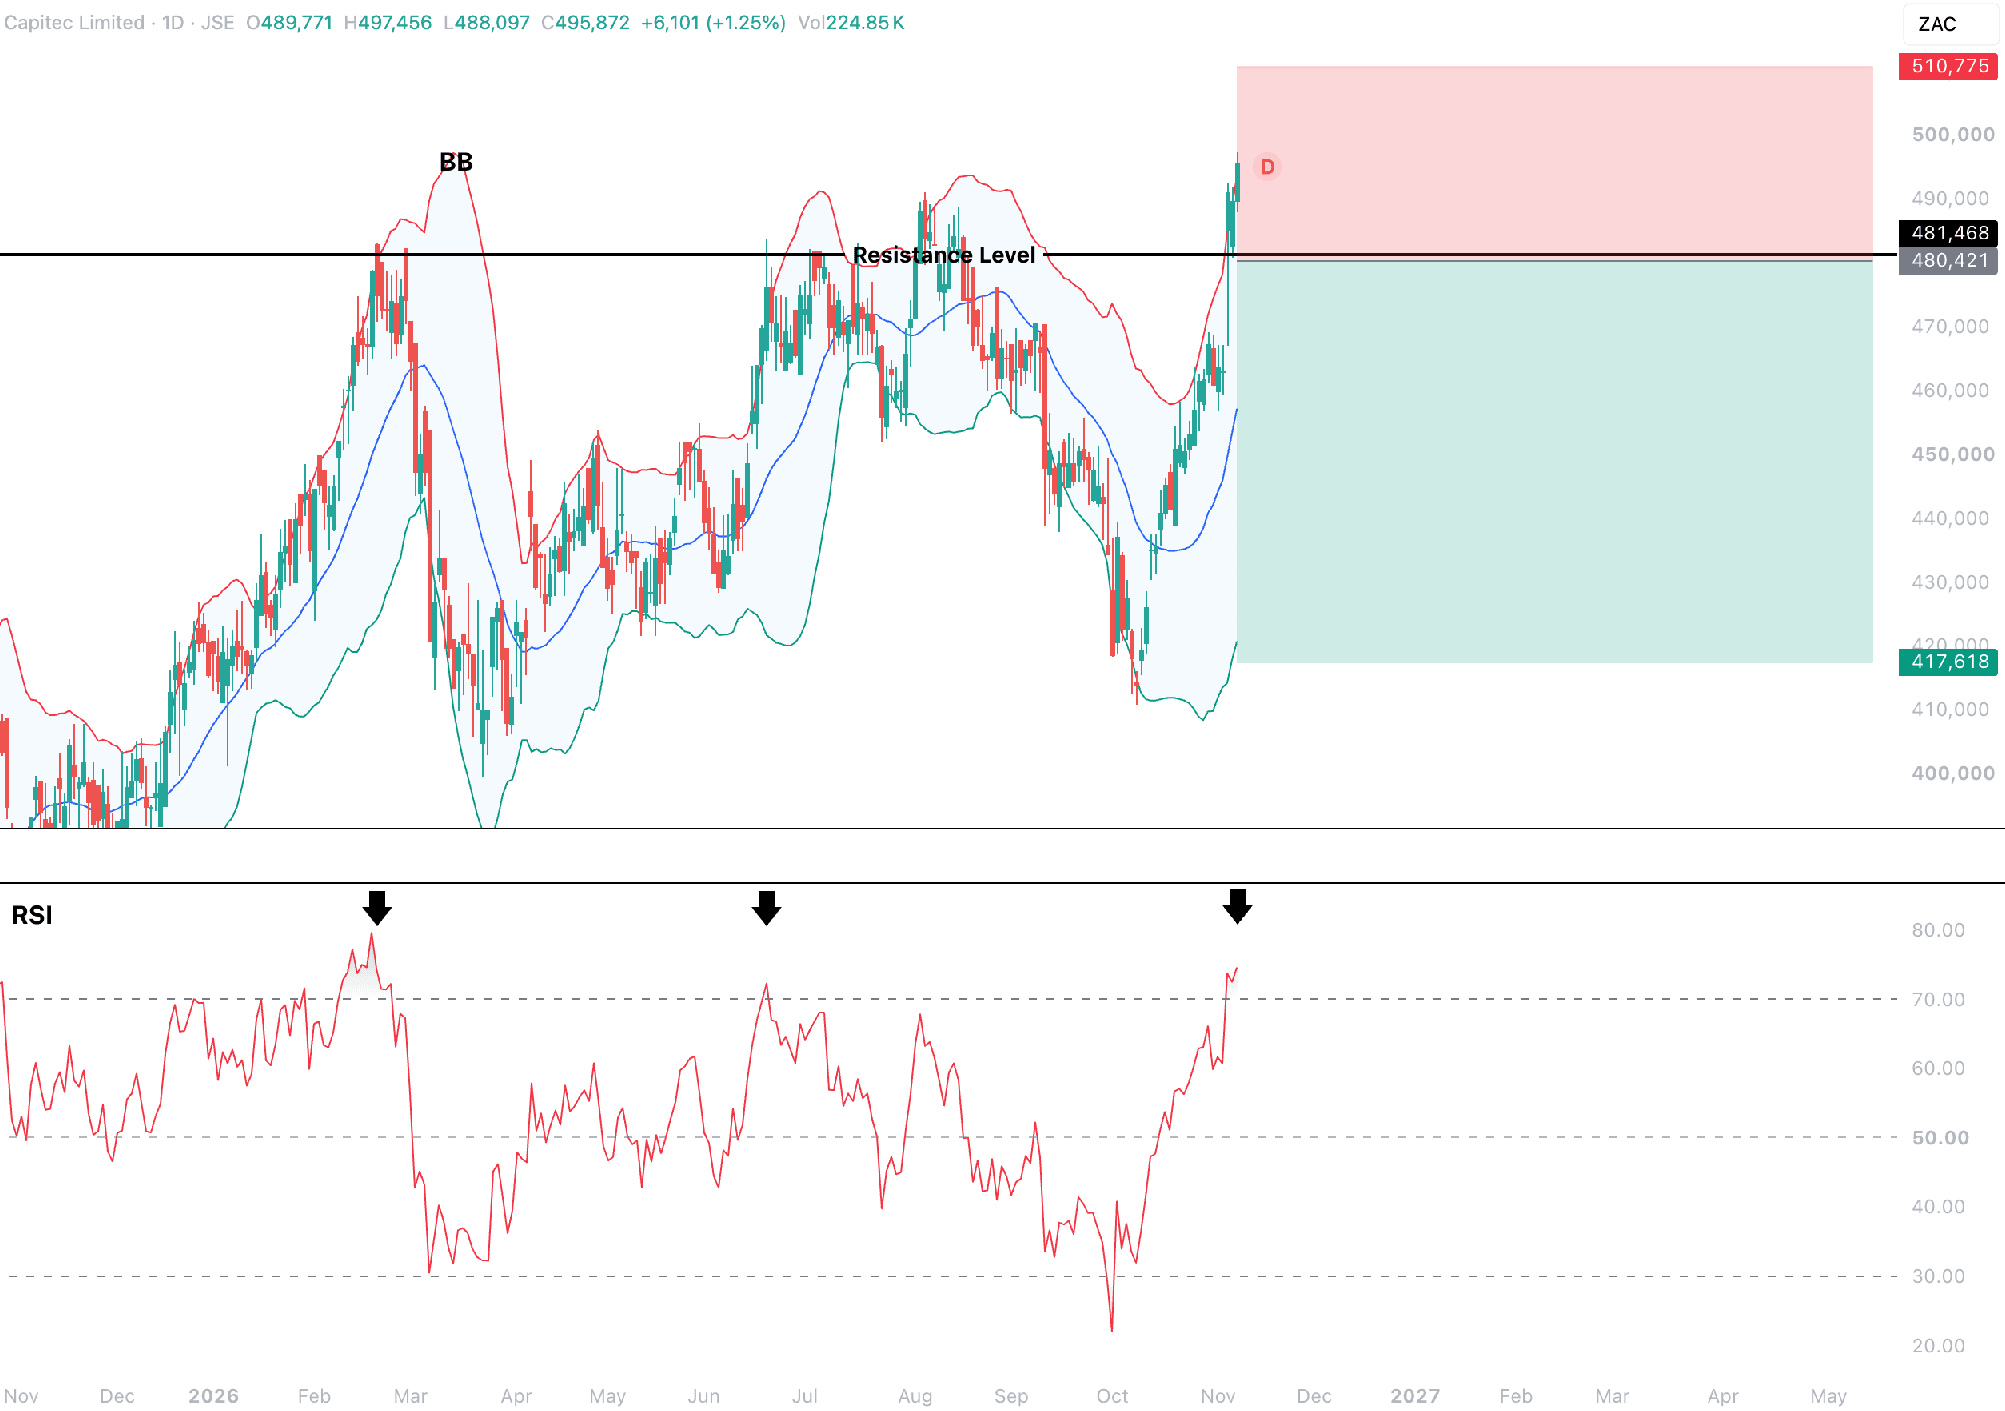
Speculative SHORT · Entry: R4 804.21 (only on a confirmed close back below the R4 814.68 resistance) · Stop R5 107.75 · Target R4 176.18 · Reward/Risk ratio 2.1:1
The setup: Price has spiked above the R4 814.68 resistance level from the October low and is pressing against the upper Bollinger Band. The RSI is above 70 for the third time; the previous two overbought readings (February and June) were both followed by pullbacks. A daily close back below resistance would put the price inside the old range again and open the way back toward the R4 176 area.
Basic Materials
KIO — Kumba Iron Ore Ltd.
Iron ore miner and Anglo American subsidiary, operating the Sishen and Kolomela mines in the Northern Cape.
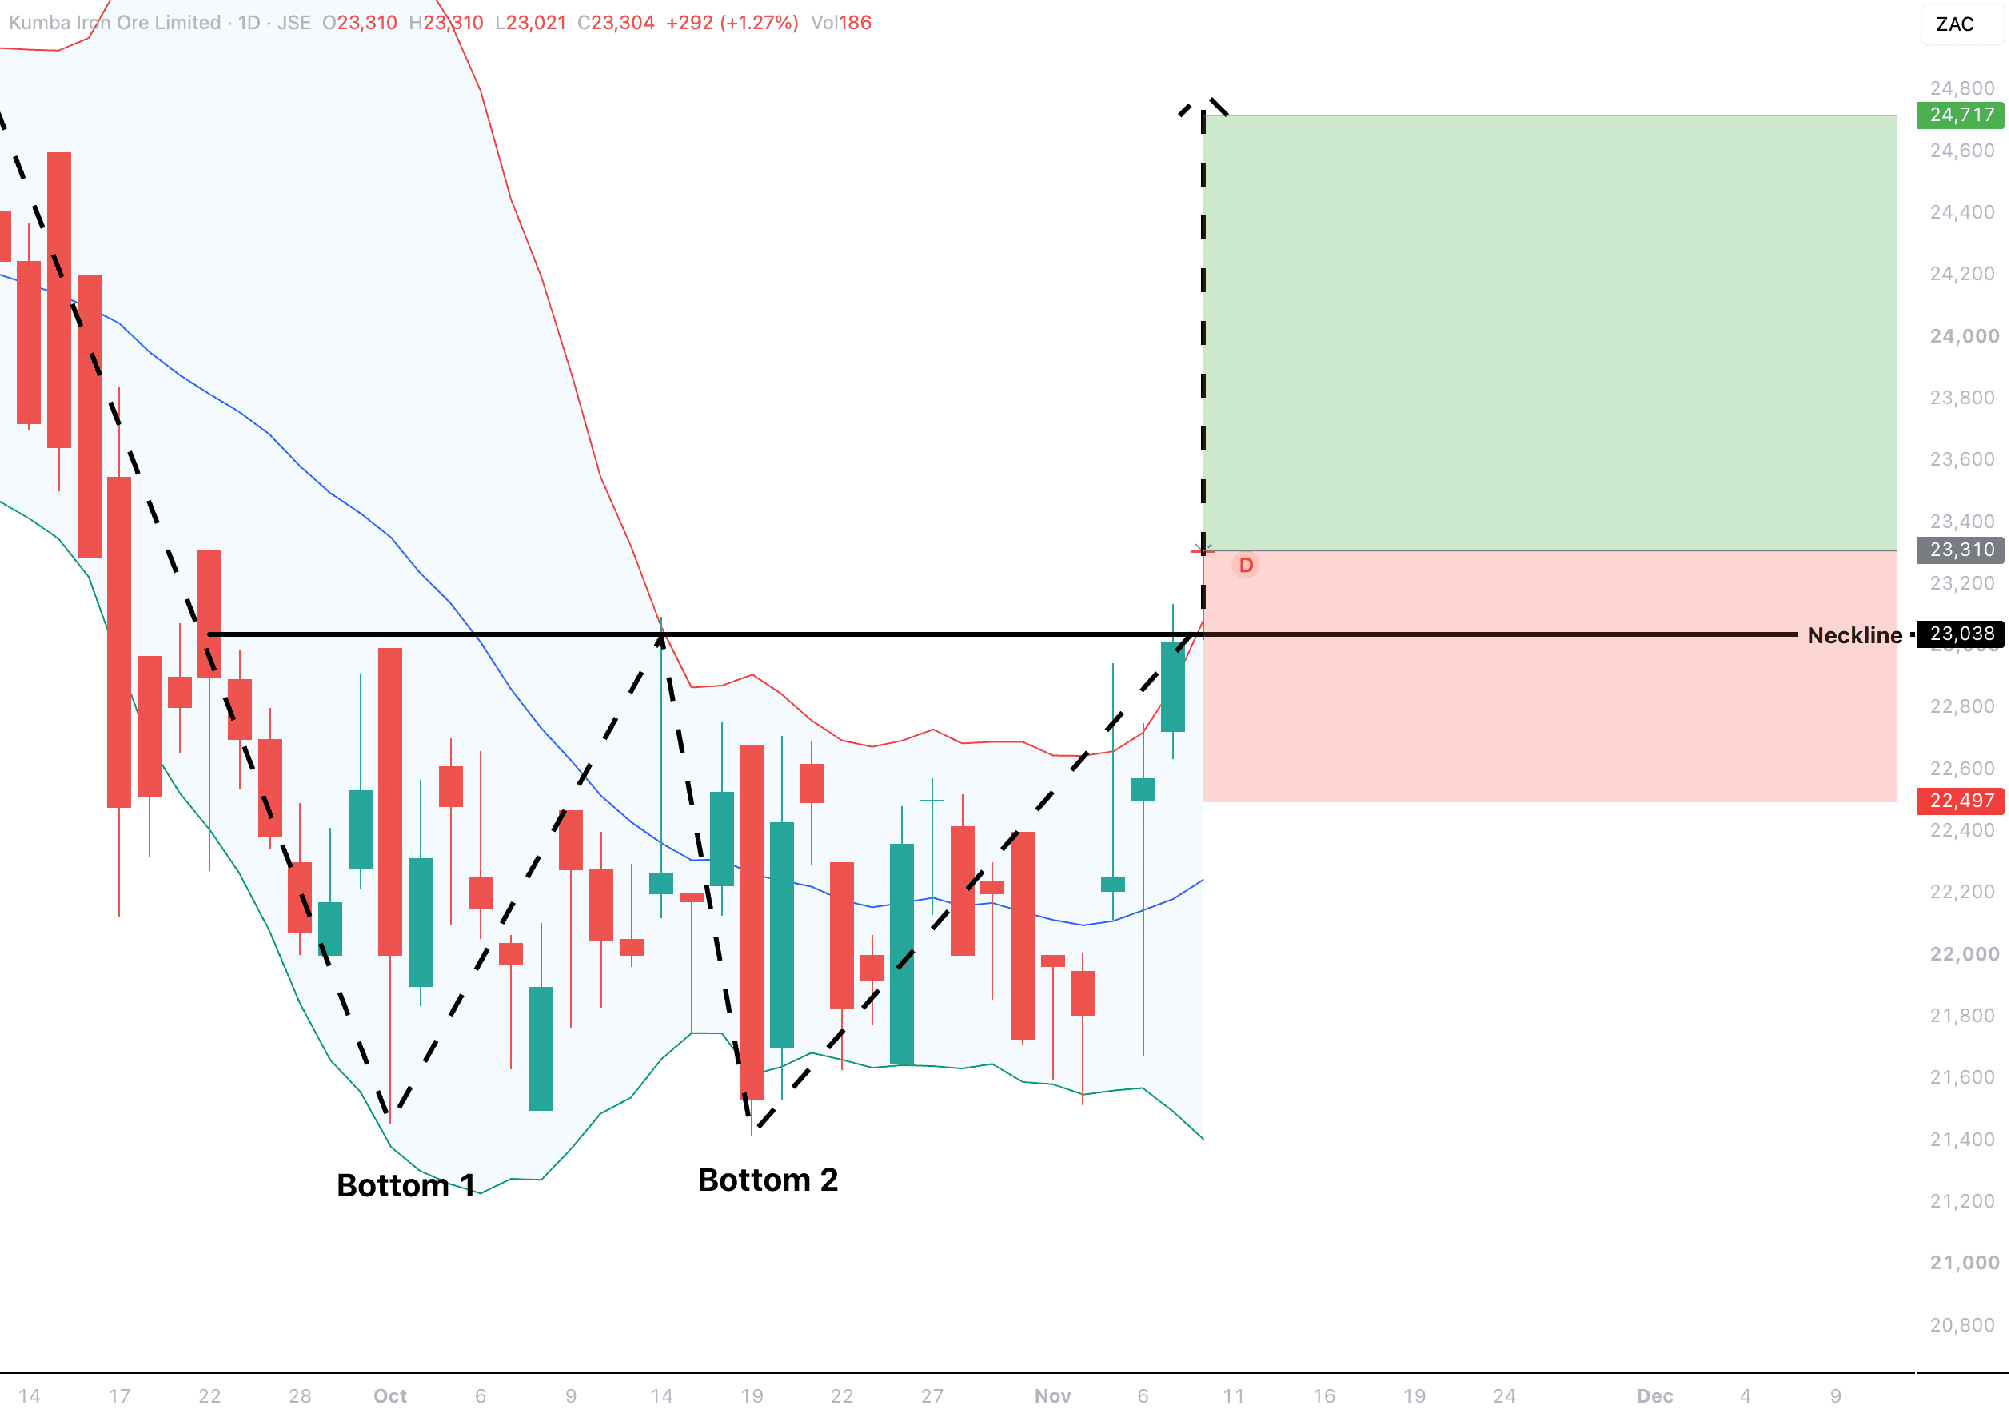
Potential LONG · Entry: R233.10 (above the neckline) · Stop R224.97 · Target R247.17 · Reward/Risk ratio 1.7:1
The setup: A double bottom has formed with both lows at roughly R214, the first around the end of September and the second in mid-October. Price has now closed above the R230.38 neckline, which confirms the pattern. The measured move from the lows to the neckline projects to the R247 target. Price is above the upper Bollinger Band, so a short pullback to retest the neckline is possible.
Consumer Goods
TBS — Tiger Brands Ltd.
Food and consumer goods manufacturer behind brands such as Albany, Koo, Jungle and Tastic.
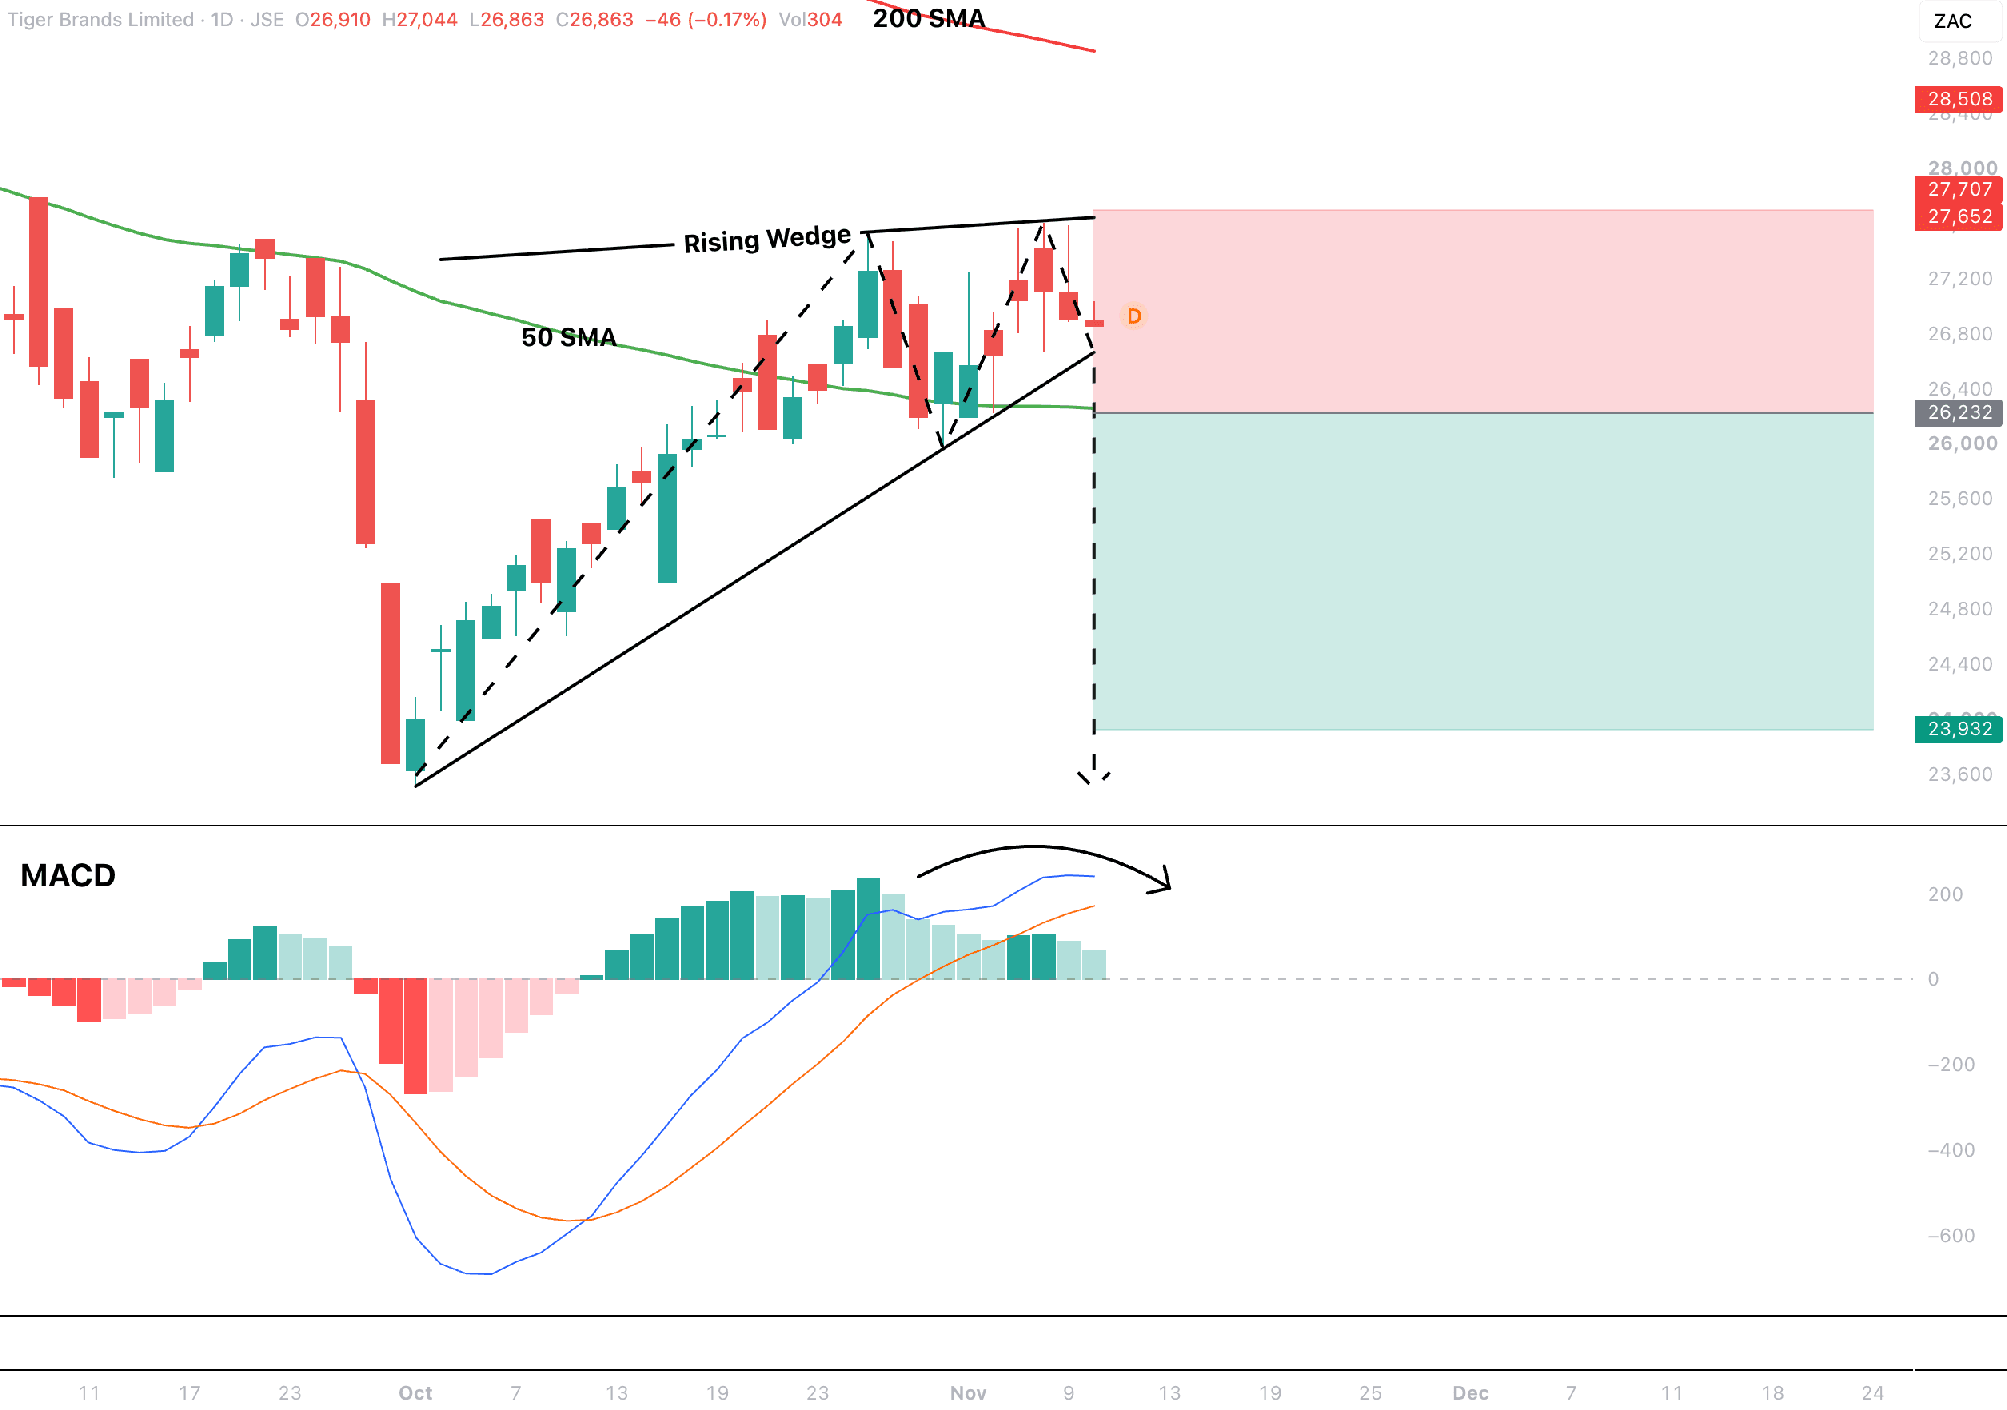
Speculative SHORT · Entry: R262.32 (only on a confirmed close below the wedge support and 50 SMA) · Stop R277.07 · Target R239.32 · Reward/Risk ratio 1.6:1
The setup: Price has climbed from the early October low inside a rising wedge, a pattern that tends to lead price lower. It is now trading near the lower wedge trendline, which lines up with the 50-day SMA near R262. The MACD is rolling over; the MACD line has flattened, so upside momentum is potentially fading. A daily close below the wedge support and 50 SMA confirms the break.
US STOCKS
Information Technology
AMD — Advanced Micro Devices Inc.
Semiconductor designer of CPUs, GPUs, and data-centre AI accelerators.
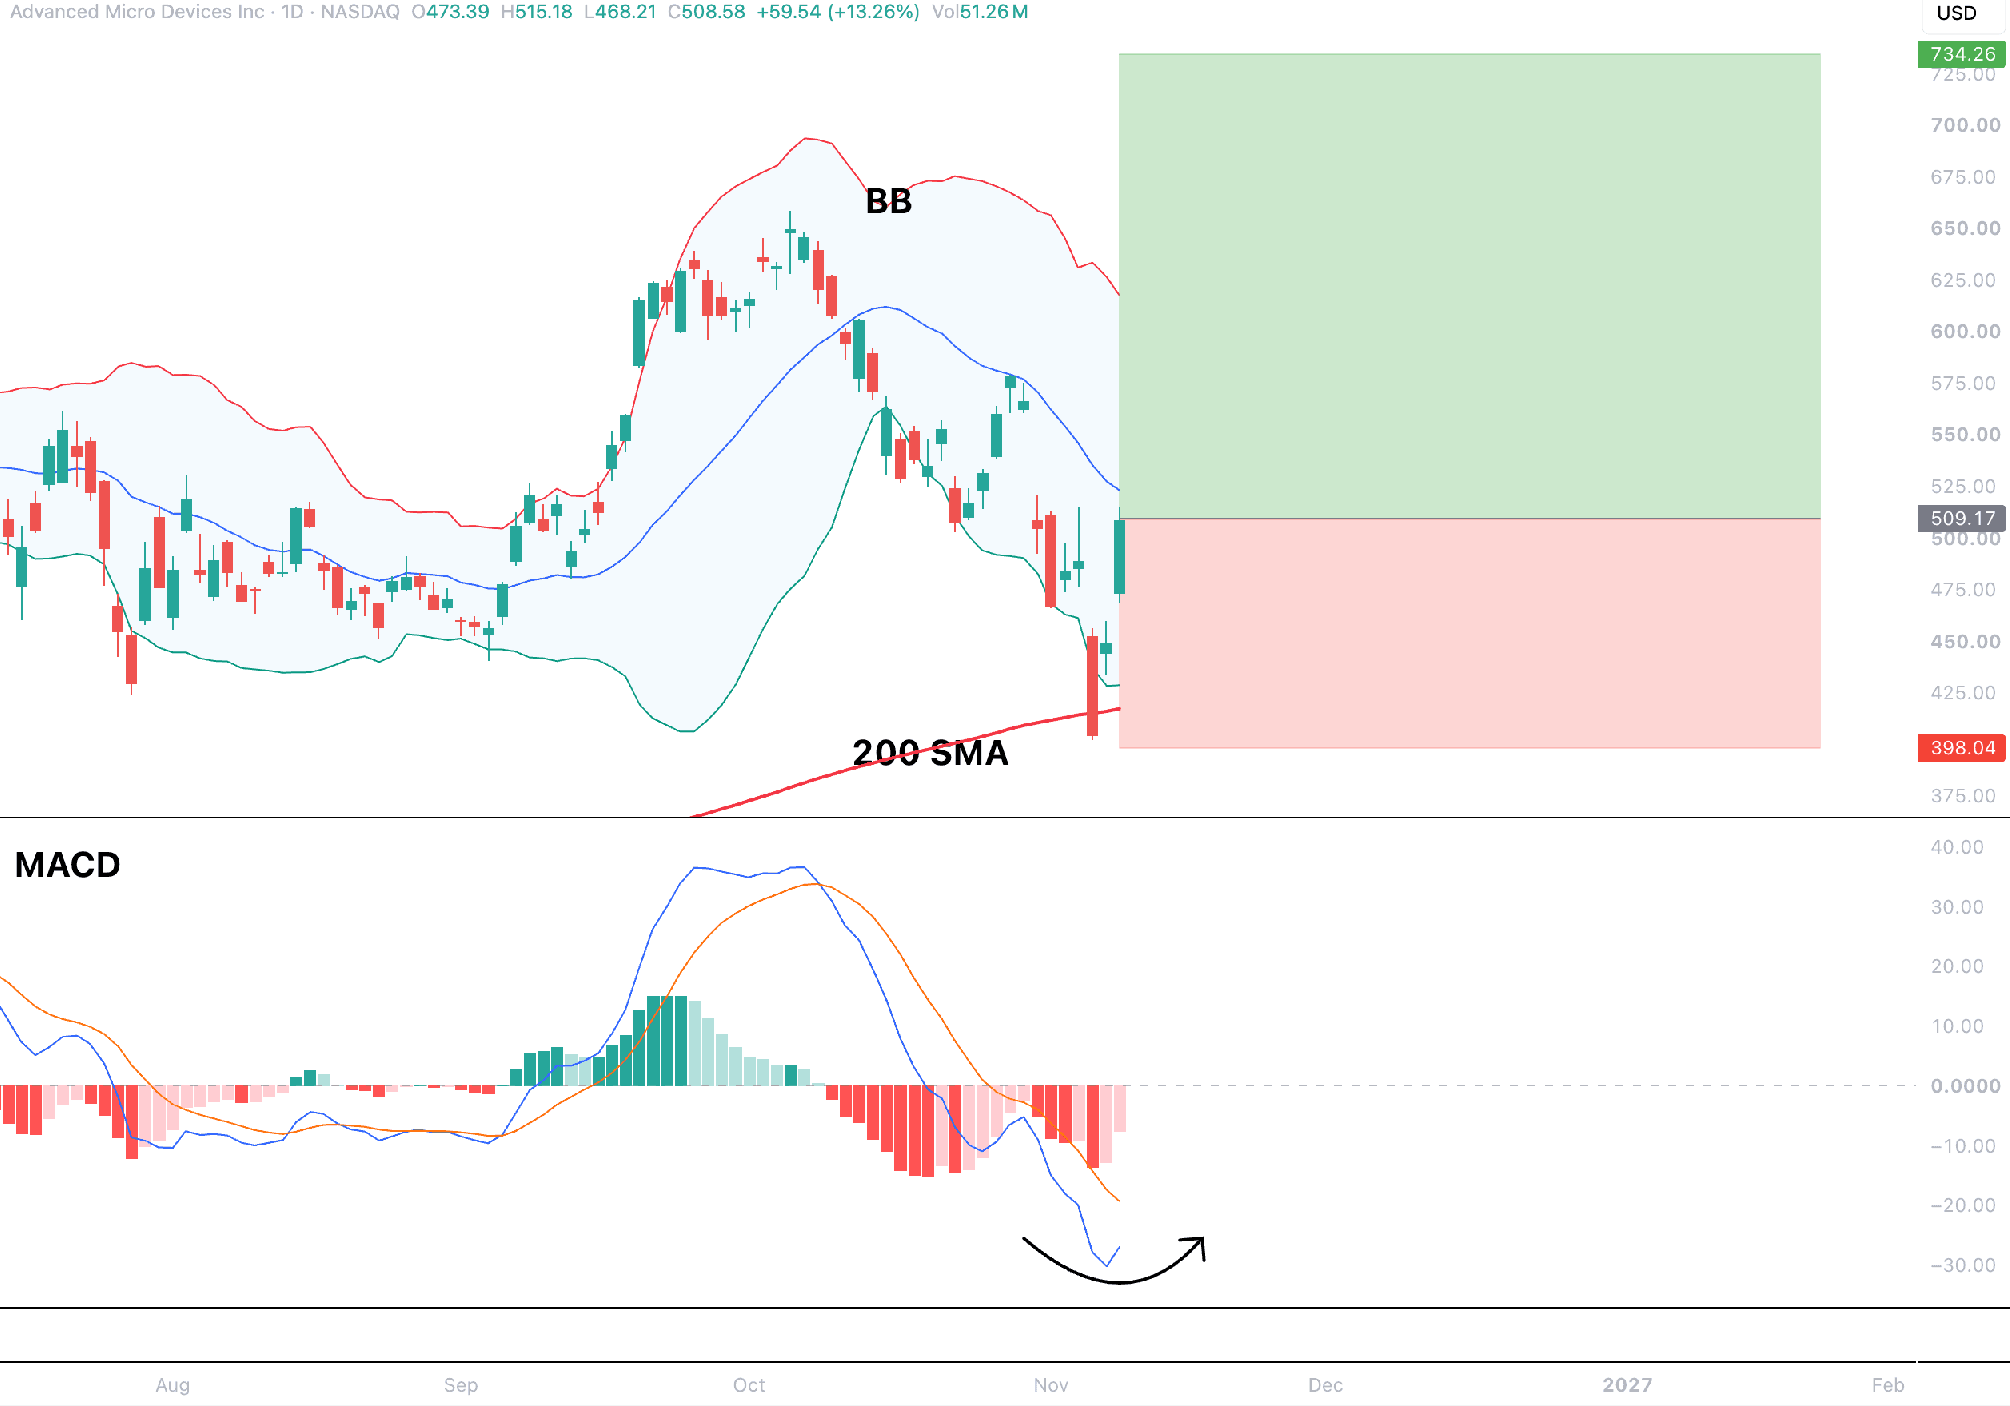
Potential LONG · Entry: $509.17 (current level) · Stop $398.04 · Target $734.26 · Reward/Risk ratio 2.0:1
The setup: A sharp sell-off took the price down to the 200-day SMA, with the low trading just beneath it, and the daily candle has reversed with about a 13% gain. Price is back inside the lower Bollinger Band and heading towards the middle band, a common mean-reversion signal after an extended drop. The MACD is deeply negative near -30, and the MACD line has turned up, so selling momentum is easing.
Industrials
BE — Bloom Energy Corp.
Maker of solid oxide fuel cell systems for on-site power generation.
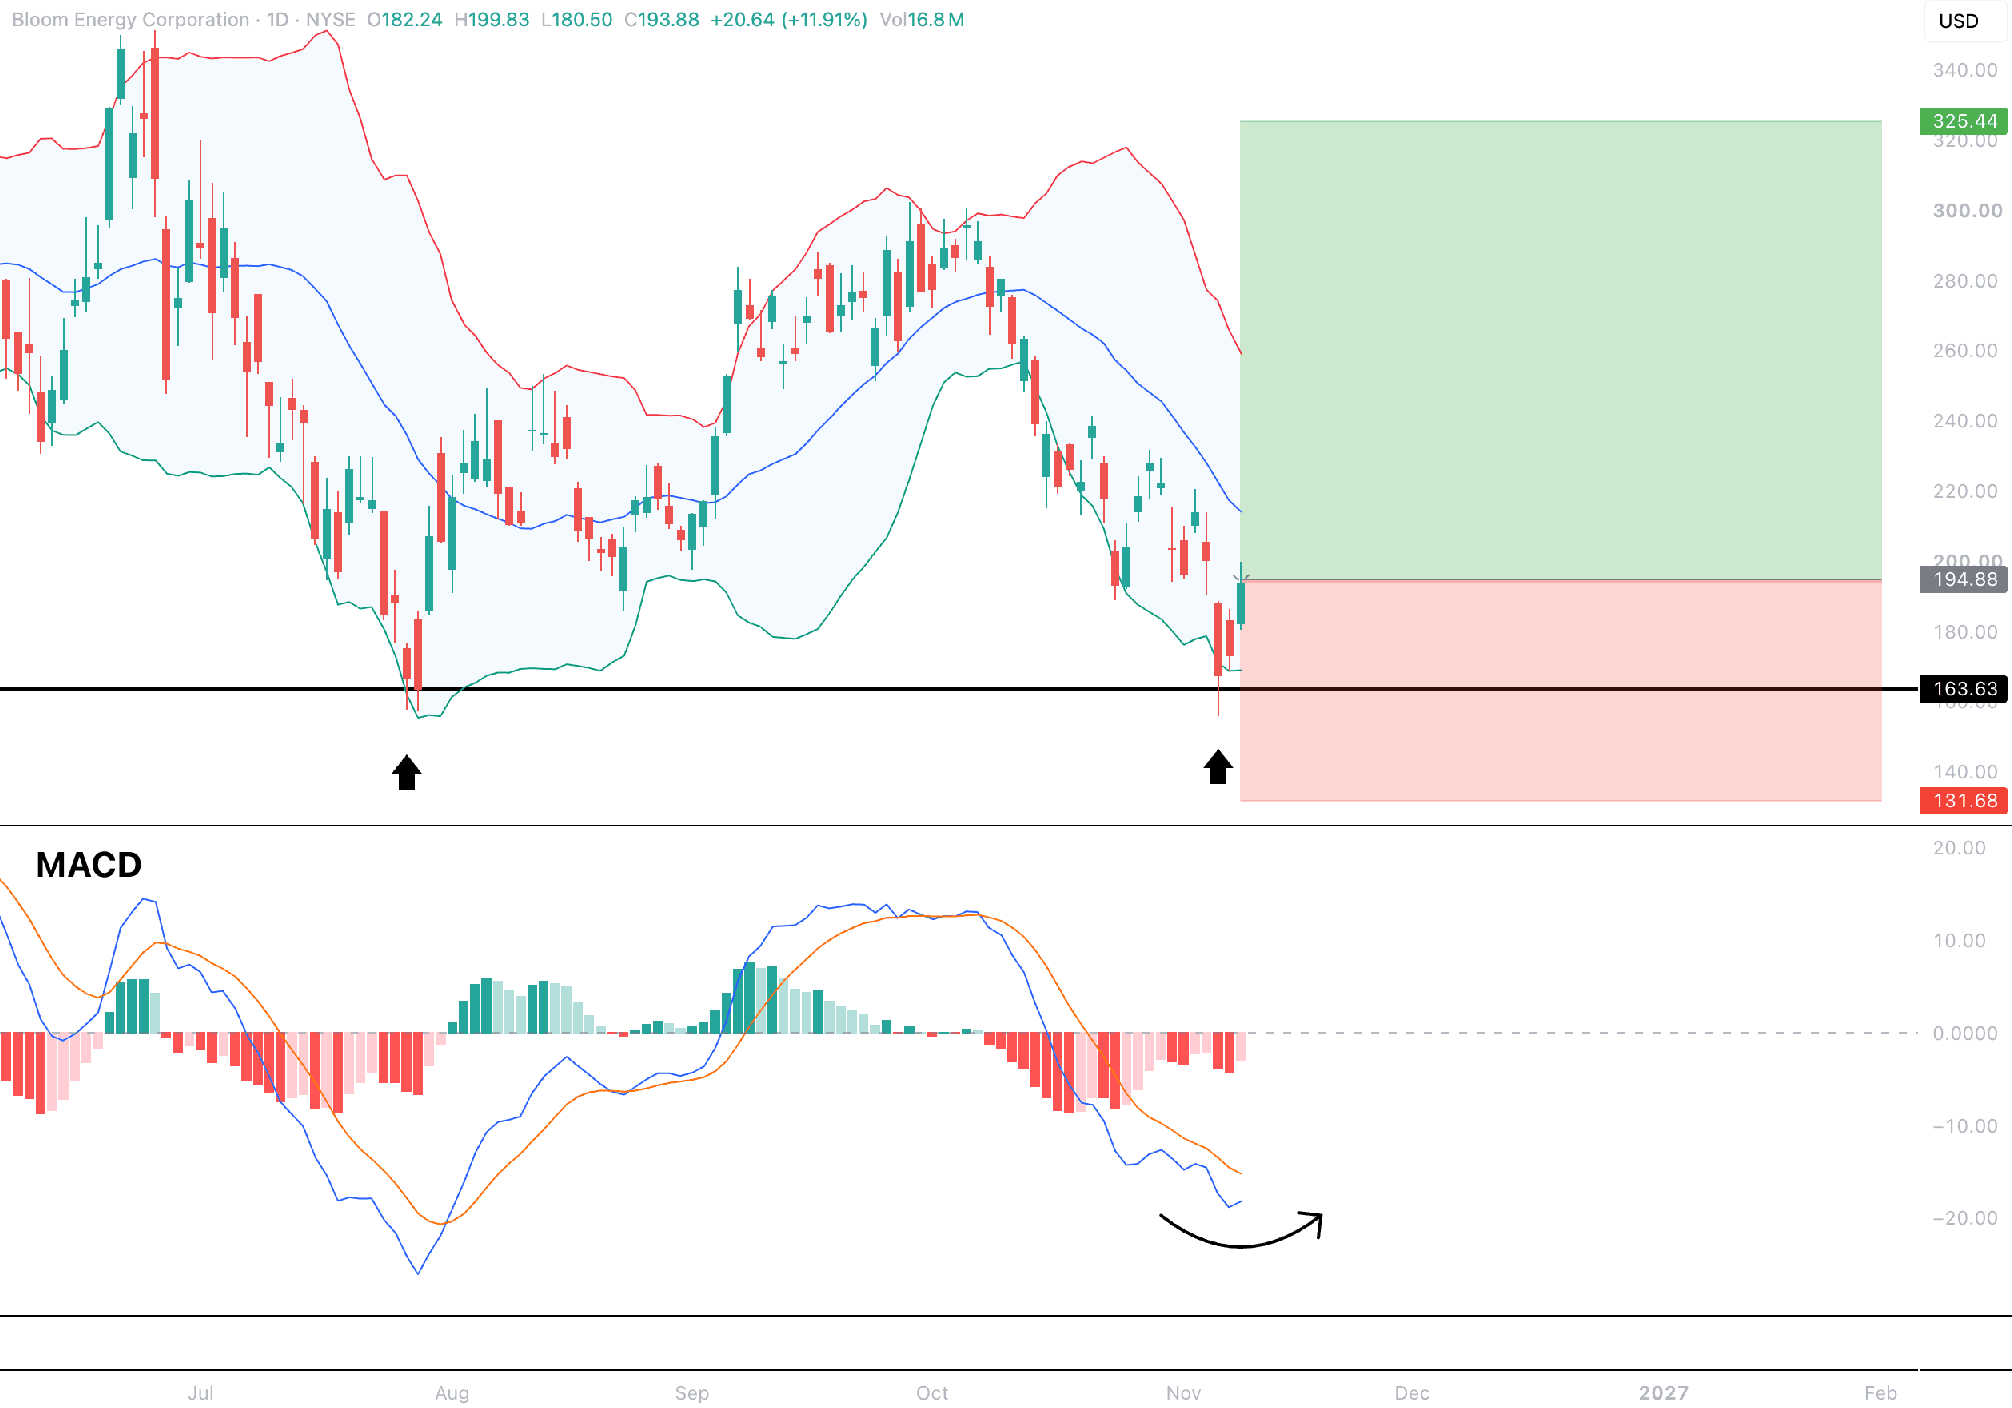
Potential LONG · Entry: $194.88 (current level) · Stop $131.68 · Target $325.44 · Reward/Risk ratio 2.1:1
The setup: Price has tested the $163.63 support area twice, in late July and again last week, and both times buyers stepped in at the lower Bollinger Band, with the wicks only briefly dipping under the level. The latest daily candle is a nearly 12% gain back above the lower band. The MACD line is potentially hooking up, and the histogram contracting, which points to a potential momentum turn. The stop is set below both wick lows to allow for volatility.
Information Technology
NVDA — NVIDIA Corp.
Designer of GPUs and accelerated computing platforms that power AI data centres, gaming and professional graphics.
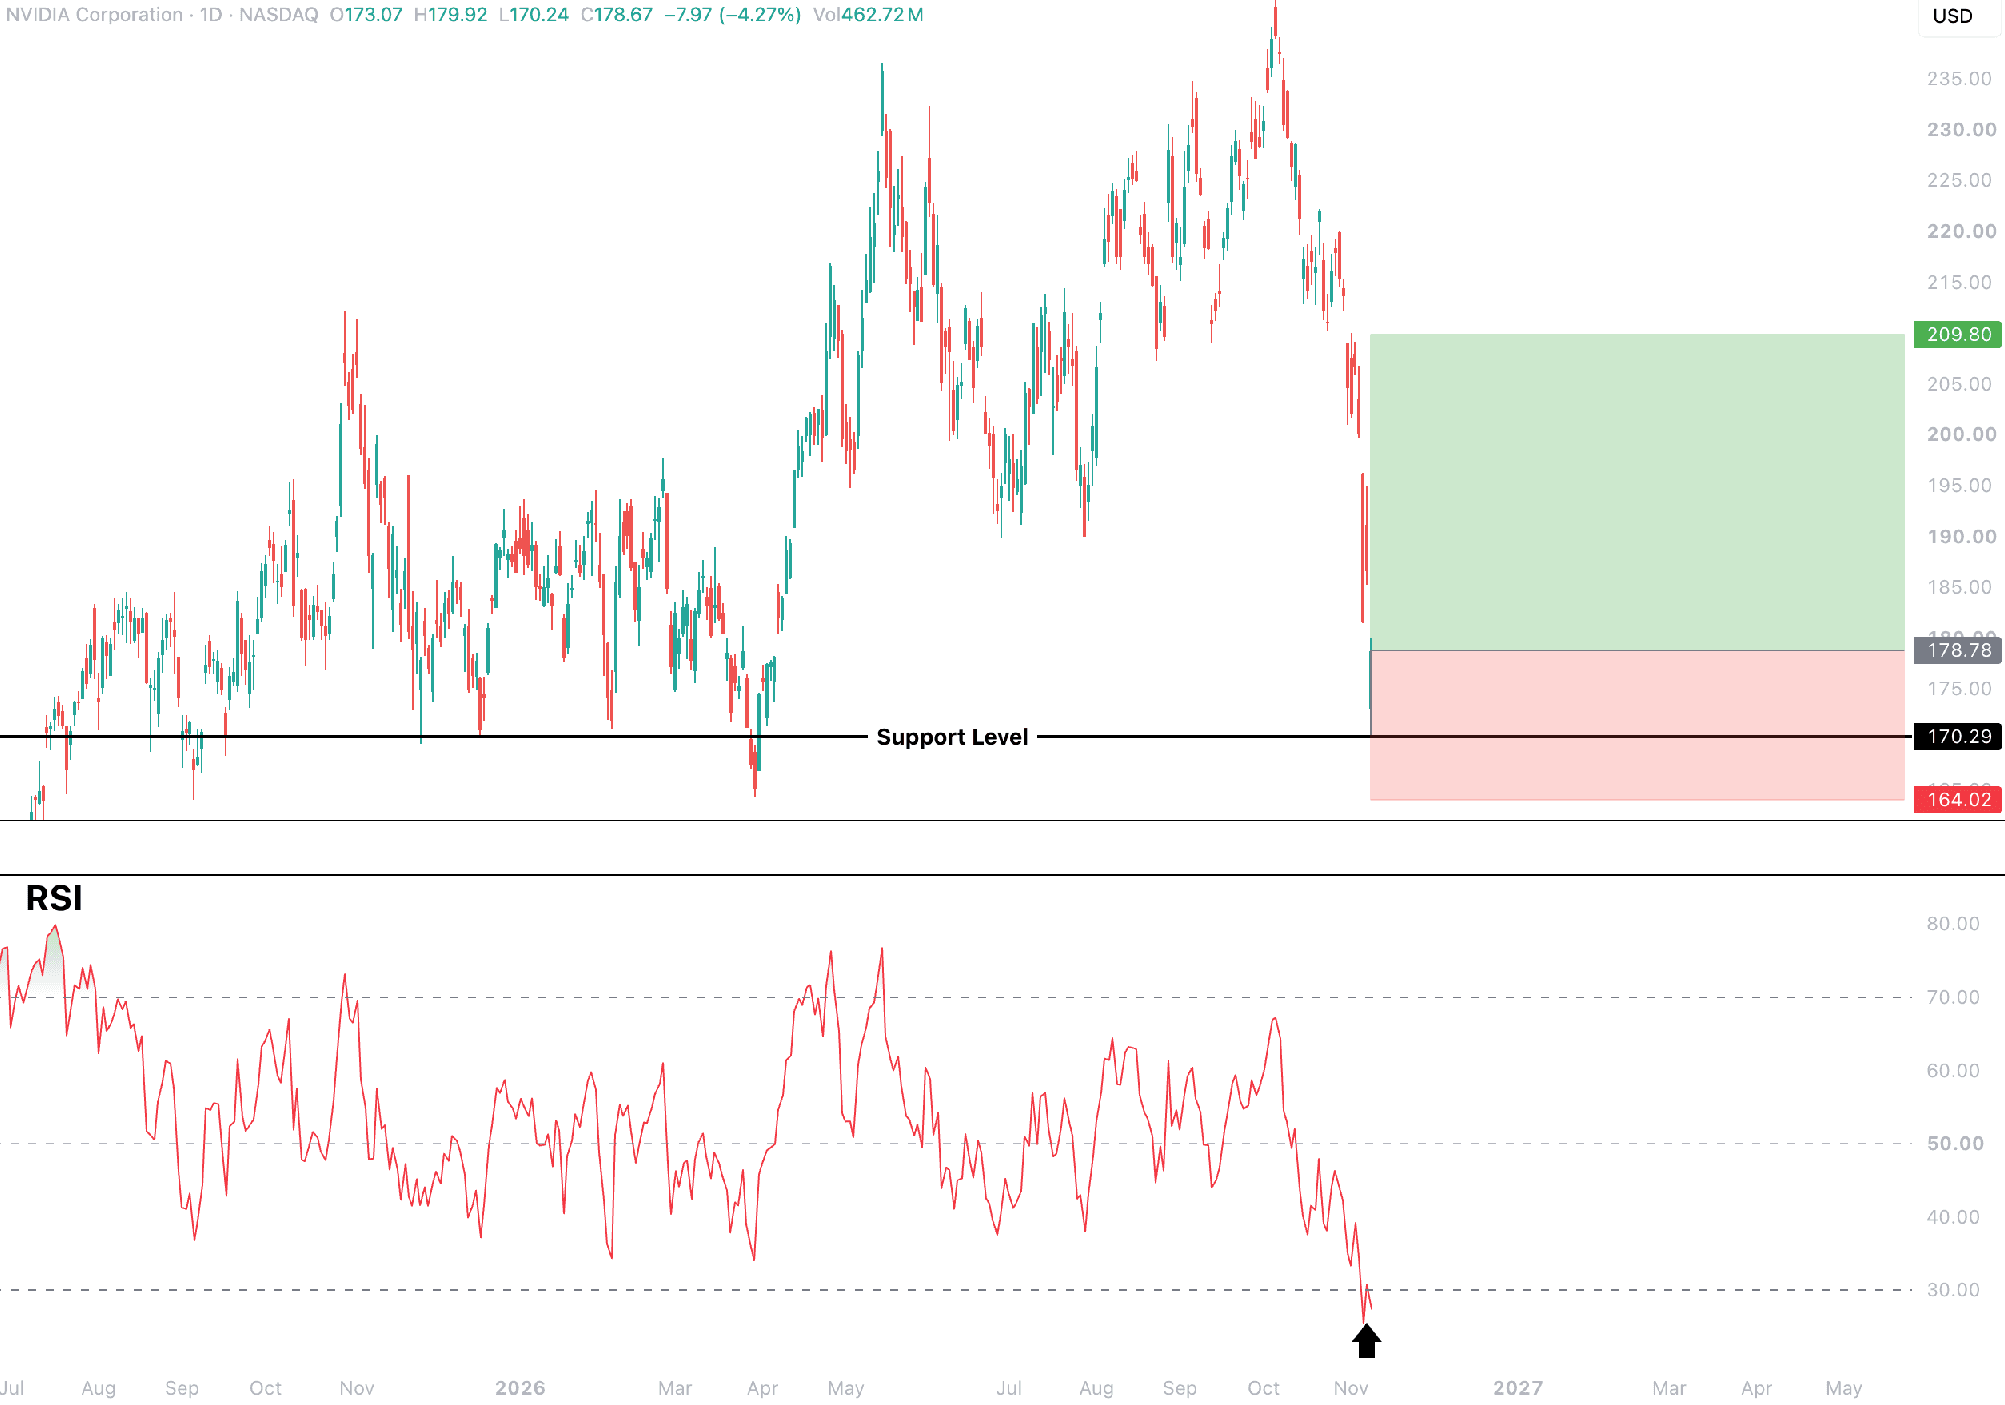
Potential LONG · Entry: $178.78 (current level) · Stop $164.02 · Target $209.80 · Reward/Risk ratio 2.1:1
The setup: Price has fallen sharply from the October highs and touched the $170.29 support level, which has held several times over the past year. The RSI recorded its lowest reading on the chart, below 30, which marks an oversold extreme. The daily candle opened near the low, wicked to $170.24 and closed above it, a sign that buyers are defending support. The stop sits just under the support zone, and the target aims for a recovery into the area where the breakdown accelerated. A daily close below support invalidates the idea.
Disclaimer:
*Any opinions, views, analysis, or other information provided in this article is provided by BROKSTOCK SA trading as BROKSTOCK as general market commentary and should not be viewed as advice according to the FAIS Act of 2002. BROKSTOCK SA does not warrant the correctness, accuracy, timeliness, reliability, or completeness of any information provided by third parties. You must rely upon your judgement in all aspects of your investment decisions, and all decisions are made at your own risk. BROKSTOCK SA and any of its employees shall not be responsible for and will not accept any liability for any direct or indirect loss, including, without limitation, any loss of profit which may arise directly or indirectly from the use of the market commentary. The content contained within the article is subject to change at any time without notice. BROKSTOCK SA is an authorised financial services provider - FSP No. 51404. T&Cs and Disclaimers are applicable: https://brokstock.co.za/
** This article was prepared by BROKSTOCK analyst Maboko Seabi
Read also



© 2026 BROKSTOCK SA (PTY) LTD.
BROKSTOCK SA (PTY) LTD is an authorised Financial Service Provider and is regulated by the South African Financial Sector Conduct Authority (FSP No.51404). BROKSTOCK SA (PTY) LTD Proprietary Limited trading as BROKSTOCK. BROKSTOCK SA (PTY) LTD t/a BROKSTOCK acts solely as an intermediary in terms of the FAIS Act, rendering only an intermediary service (i.e., no market making is conducted by BROKSTOCK SA (PTY) LTD t/a BROKSTOCK) in relation to derivative products (CFDs) offered by the liquidity providers. Therefore, BROKSTOCK SA (PTY) LTD t/a BROKSTOCK does not act as the principal or the counterparty to any of its transactions.
The materials on this website (the “Site”) are intended for informational purposes only. Use of and access to the Site and the information, materials, services, and other content available on or through the Site (“Content”) are subject to the laws of South Africa.
Risk notice Margin trading in financial instruments carries a high level of risk, and may not be suitable for all users. It is essential to understand that investing in financial instruments requires extensive knowledge and significant experience in the investment field, as well as an understanding of the nature and complexity of financial instruments, and the ability to determine the volume of investment and assess the associated risks. BROKSTOCK SA (PTY) LTD pays attention to the fact that quotes, charts and conversion rates, prices, analytic indicators and other data presented on this website may not correspond to quotes on trading platforms and are not necessarily real-time nor accurate. The delay of the data in relation to real-time is equal to 15 minutes but is not limited. This indicates that prices may differ from actual prices in the relevant market, and are not suitable for trading purposes. Before deciding to trade the products offered by BROKSTOCK SA (PTY) LTD, a user should carefully consider his objectives, financial position, needs and level of experience. The Content is for informational purposes only and it should not construe any such information or other material as legal, tax, investment, financial, or other advice. BROKSTOCK SA (PTY) LTD will not accept any liability for loss or damage as a result of reliance on the information contained within this Site including data, quotes, conversion rates, etc.
Third party content BROKSTOCK SA (PTY) LTD may provide materials produced by third parties or links to other websites. Such materials and websites are provided by third parties and are not under BROKSTOCK SA (PTY) LTD's direct control. In exchange for using the Site, the user agrees not to hold BROKSTOCK SA (PTY) LTD, its affiliates or any third party service provider liable for any possible claim for damages arising from any decision user makes based on information or other Content made available to the user through the Site.
Limitation of liability The user’s exclusive remedy for dissatisfaction with the Site and Content is to discontinue using the Site and Content. BROKSTOCK SA (PTY) LTD is not liable for any direct, indirect, incidental, consequential, special or punitive damages. Working with BROKSTOCK SA (PTY) LTD you are trading share CFDs. When trading CFDs on shares you do not own the underlying asset. Share CFDs are complex instruments and come with a high risk of losing money rapidly due to leverage. A high percentage of retail traders accounts lose money when trading CFDs with their provider. All rights reserved. Any use of Site materials without permission is prohibited.