
A potential divergence is defining the U.S. stock market. The US30 (Dow Jones Industrial Average), an index of American industrial and economic might, is trading around all-time highs. In contrast, the US100 (Nasdaq-100), the long-reigning benchmark for technology and growth, is faltering under the weight of a sector-wide selloff. The divergence is not a random fluctuation; it is a market rotation, in which capital is systematically shifting from high-flying tech darlings into more traditional, value-driven, and defensive companies.
This analytical article examines the dynamics underlying this trend, drawing parallels between current events and a similar shock from exactly one year earlier.
The following chart illustrates the performance gap between the US30 (green line) and the US100 (red line) since the beginning of 2025. It captures not just the current divergence, but also the critical precedent set exactly one year ago.
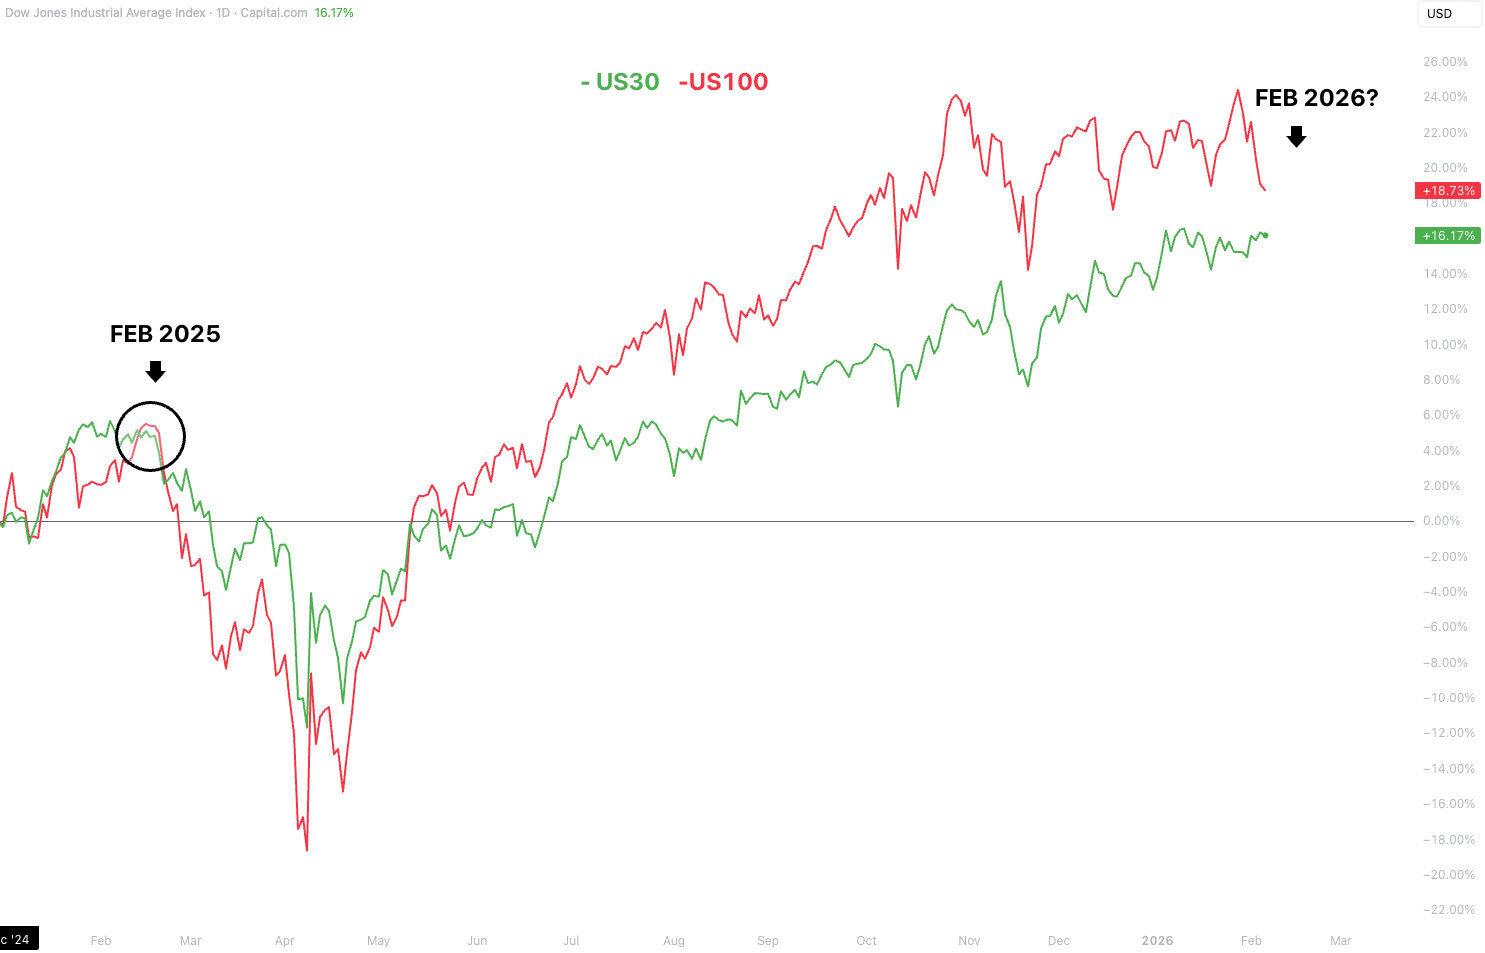
Two points on this chart are of critical importance. The first is the circle in February 2025. The second is the sharp downturn happening now, in February 2026.
As the chart clearly shows, in February 2025, the tech-heavy US100 (red line) decisively crossed below the more defensive US30 (green line). This event was not random. It was the direct result of the DeepSeek shock, when a Chinese AI startup released a highly efficient AI model that could be trained for a fraction of the cost of US competitors.
This news triggered a fundamental fear among investors: “If AI can be built this cheaply, is the expensive AI hardware from companies like Nvidia still worth its premium?”
The market’s reaction was swift and brutal. Investors began selling off high-valuation AI infrastructure stocks, causing the US100 to plunge. Simultaneously, that capital rotated into the perceived safety of the value and defensive stocks that populate the Dow Jones, causing the US30 to hold its ground and then pull ahead. The crossover on the chart marks the precise moment this rotation took hold.
Almost exactly one year later, history appears to be repeating itself. The immediate trigger for the current tech selloff is the Anthropic shock. The release of its Claude Cowork tool, an AI colleague capable of automating complex workflows, has triggered a new wave of concern across the software-as-a-service (SaaS) industry.
This time, the market is asking a similar, but broader, question.
This fear materialised in an adverse market reaction. In early February 2026, software industry ETFs plunged nearly 6%, erasing almost $1 trillion in value from the global software and services sector. Companies like Thomson Reuters (-15.8%), LegalZoom (-19.7%), Salesforce (-7%), and Intuit (-11%) saw their valuations plummet.
The striking similarity in timing, a major AI disruption event occurring in early February, almost exactly one year apart, raises a critical analytical question. Will the Anthropic event cause the US100 to follow the same path it did in 2025?
The chart shows the US100 taking a sharp downturn in February 2026, mirroring the initial drop from February 2025. The psychological pattern is identical; a breakthrough in AI capability leads to a rapid repricing of risk in the technology sector, sparking a flight to safety.
While past performance is not a guarantee of future results, the precedent set by the DeepSeek event provides a powerful historical parallel. The market is now closely watching whether this rotation will continue, potentially leading to a sustained period of underperformance for the tech sector and continued strength for the defensive and value-oriented companies in the Dow Jones.
This rotation is the primary driver of the divergence among the major indices. As investors prioritise stability and profitability, capital flows into:
● Defensive stocks: Companies in non-cyclical sectors whose products are needed regardless of the economic climate, such as consumer staples, Procter & Gamble, healthcare, Johnson & Johnson, and utilities, NextEra Energy.
● Value stocks: Established companies trading at a reasonable price relative to their fundamentals, often found in sectors like financials, JPMorgan Chase, industrials, Caterpillar, and energy, Chevron and ExxonMobil.
The US30’s resilience is structural. With only ~20% exposure to technology, compared to the US100’s +50%, it is more insulated from these tech-specific shocks and is the primary beneficiary of this flight to safety.
The current environment highlights the importance of diversification and understanding different investment themes. Exploring opportunities within the defensive sectors, such as consumer staples, healthcare, and utilities or the value-driven sectors of energy and industrials, allows for alignment with the prevailing market trends. These areas are traditionally sought after for their potential to offer stability during periods of volatility and uncertainty.
To explore these opportunities further, you can use the platform’s tools to research individual companies in these sectors, analyse their performance with charting, and stay informed on the latest market analysis. Understanding the dynamics of a rotating market is the first step toward making informed decisions.
Disclaimer:
*Any opinions, views, analysis, or other information provided in this article is provided by BROKSTOCK SA trading as BROKSTOCK as general market commentary and should not be viewed as advice according to the FAIS Act of 2002. BROKSTOCK SA does not warrant the correctness, accuracy, timeliness, reliability, or completeness of any information provided by third parties. You must rely upon your judgement in all aspects of your investment decisions, and all decisions are made at your own risk. BROKSTOCK SA and any of its employees shall not be responsible for and will not accept any liability for any direct or indirect loss, including, without limitation, any loss of profit which may arise directly or indirectly from the use of the market commentary. The content contained within the article is subject to change at any time without notice. BROKSTOCK SA is an authorised financial services provider - FSP No. 51404. T&Cs and Disclaimers are applicable: https://brokstock.co.za/
** This article was prepared by BROKSTOCK analyst Maboko Seabi
© 2026 BROKSTOCK SA (PTY) LTD.
BROKSTOCK SA (PTY) LTD is an authorised Financial Service Provider and is regulated by the South African Financial Sector Conduct Authority (FSP No.51404). BROKSTOCK SA (PTY) LTD Proprietary Limited trading as BROKSTOCK. BROKSTOCK SA (PTY) LTD t/a BROKSTOCK acts solely as an intermediary in terms of the FAIS Act, rendering only an intermediary service (i.e., no market making is conducted by BROKSTOCK SA (PTY) LTD t/a BROKSTOCK) in relation to derivative products (CFDs) offered by the liquidity providers. Therefore, BROKSTOCK SA (PTY) LTD t/a BROKSTOCK does not act as the principal or the counterparty to any of its transactions.
The materials on this website (the “Site”) are intended for informational purposes only. Use of and access to the Site and the information, materials, services, and other content available on or through the Site (“Content”) are subject to the laws of South Africa.
Risk notice Margin trading in financial instruments carries a high level of risk, and may not be suitable for all users. It is essential to understand that investing in financial instruments requires extensive knowledge and significant experience in the investment field, as well as an understanding of the nature and complexity of financial instruments, and the ability to determine the volume of investment and assess the associated risks. BROKSTOCK SA (PTY) LTD pays attention to the fact that quotes, charts and conversion rates, prices, analytic indicators and other data presented on this website may not correspond to quotes on trading platforms and are not necessarily real-time nor accurate. The delay of the data in relation to real-time is equal to 15 minutes but is not limited. This indicates that prices may differ from actual prices in the relevant market, and are not suitable for trading purposes. Before deciding to trade the products offered by BROKSTOCK SA (PTY) LTD, a user should carefully consider his objectives, financial position, needs and level of experience. The Content is for informational purposes only and it should not construe any such information or other material as legal, tax, investment, financial, or other advice. BROKSTOCK SA (PTY) LTD will not accept any liability for loss or damage as a result of reliance on the information contained within this Site including data, quotes, conversion rates, etc.
Third party content BROKSTOCK SA (PTY) LTD may provide materials produced by third parties or links to other websites. Such materials and websites are provided by third parties and are not under BROKSTOCK SA (PTY) LTD's direct control. In exchange for using the Site, the user agrees not to hold BROKSTOCK SA (PTY) LTD, its affiliates or any third party service provider liable for any possible claim for damages arising from any decision user makes based on information or other Content made available to the user through the Site.
Limitation of liability The user’s exclusive remedy for dissatisfaction with the Site and Content is to discontinue using the Site and Content. BROKSTOCK SA (PTY) LTD is not liable for any direct, indirect, incidental, consequential, special or punitive damages. Working with BROKSTOCK SA (PTY) LTD you are trading share CFDs. When trading CFDs on shares you do not own the underlying asset. Share CFDs are complex instruments and come with a high risk of losing money rapidly due to leverage. A high percentage of retail traders accounts lose money when trading CFDs with their provider. All rights reserved. Any use of Site materials without permission is prohibited.