Forex Technical Analysis Strategies
Technical analysis in Forex is an essential trading tool. It involves examining historical price data to forecast future market movements. This guide explores the core concepts of technical analysis, the different strategies it encompasses, and the essential phases in creating a successful Forex technical analysis strategy.
What Is Technical Analysis in Forex?
Technical analysis refers to the systematic examination of historical price data and market statistics to forecast future price movements in various financial instruments. This analysis is grounded in the belief that historical price patterns and market behaviour can provide valuable insights into potential future price trends.
Explaining Technical Analysis
Technical analysis in Forex involves using various tools and methodologies to analyse price charts, patterns, and indicators. Traders use this analysis to make informed decisions about buying or selling currency pairs. The primary assumption is that market prices move in trends, and by analysing these trends, traders can identify potential trading opportunities.
What Are the Types of Forex Technical Analysis Strategies?
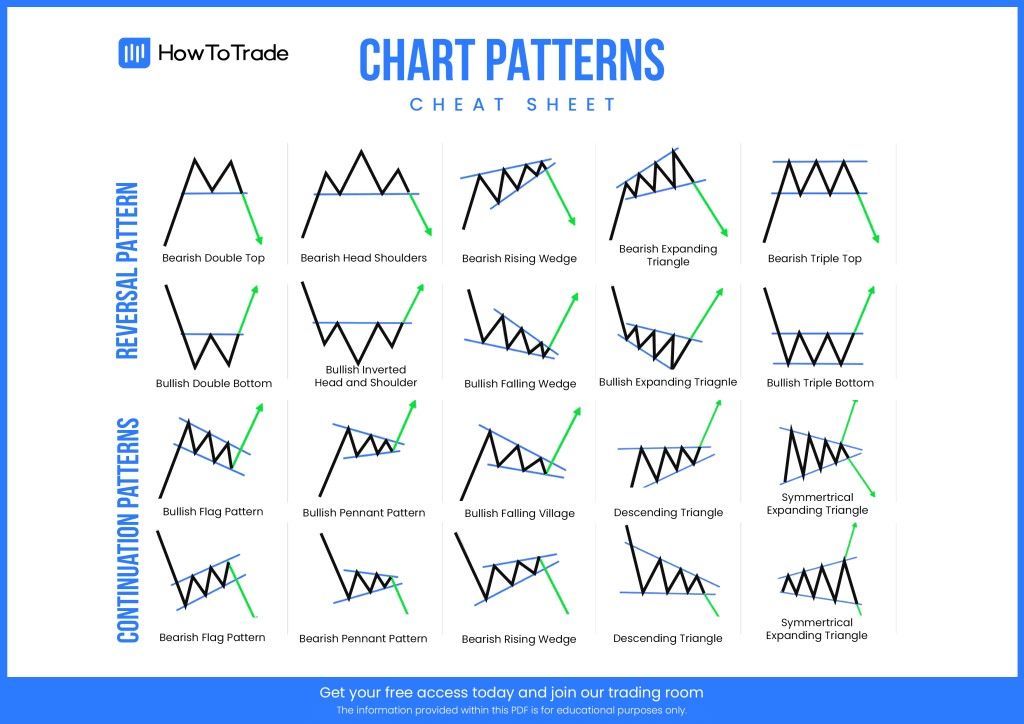
Chart Patterns
Chart patterns play a significant role in technical analysis. Traders closely monitor patterns like head and shoulders, double tops and bottoms, and flags. These patterns provide valuable insights into potential trend reversals or continuations, helping traders make well-informed decisions.
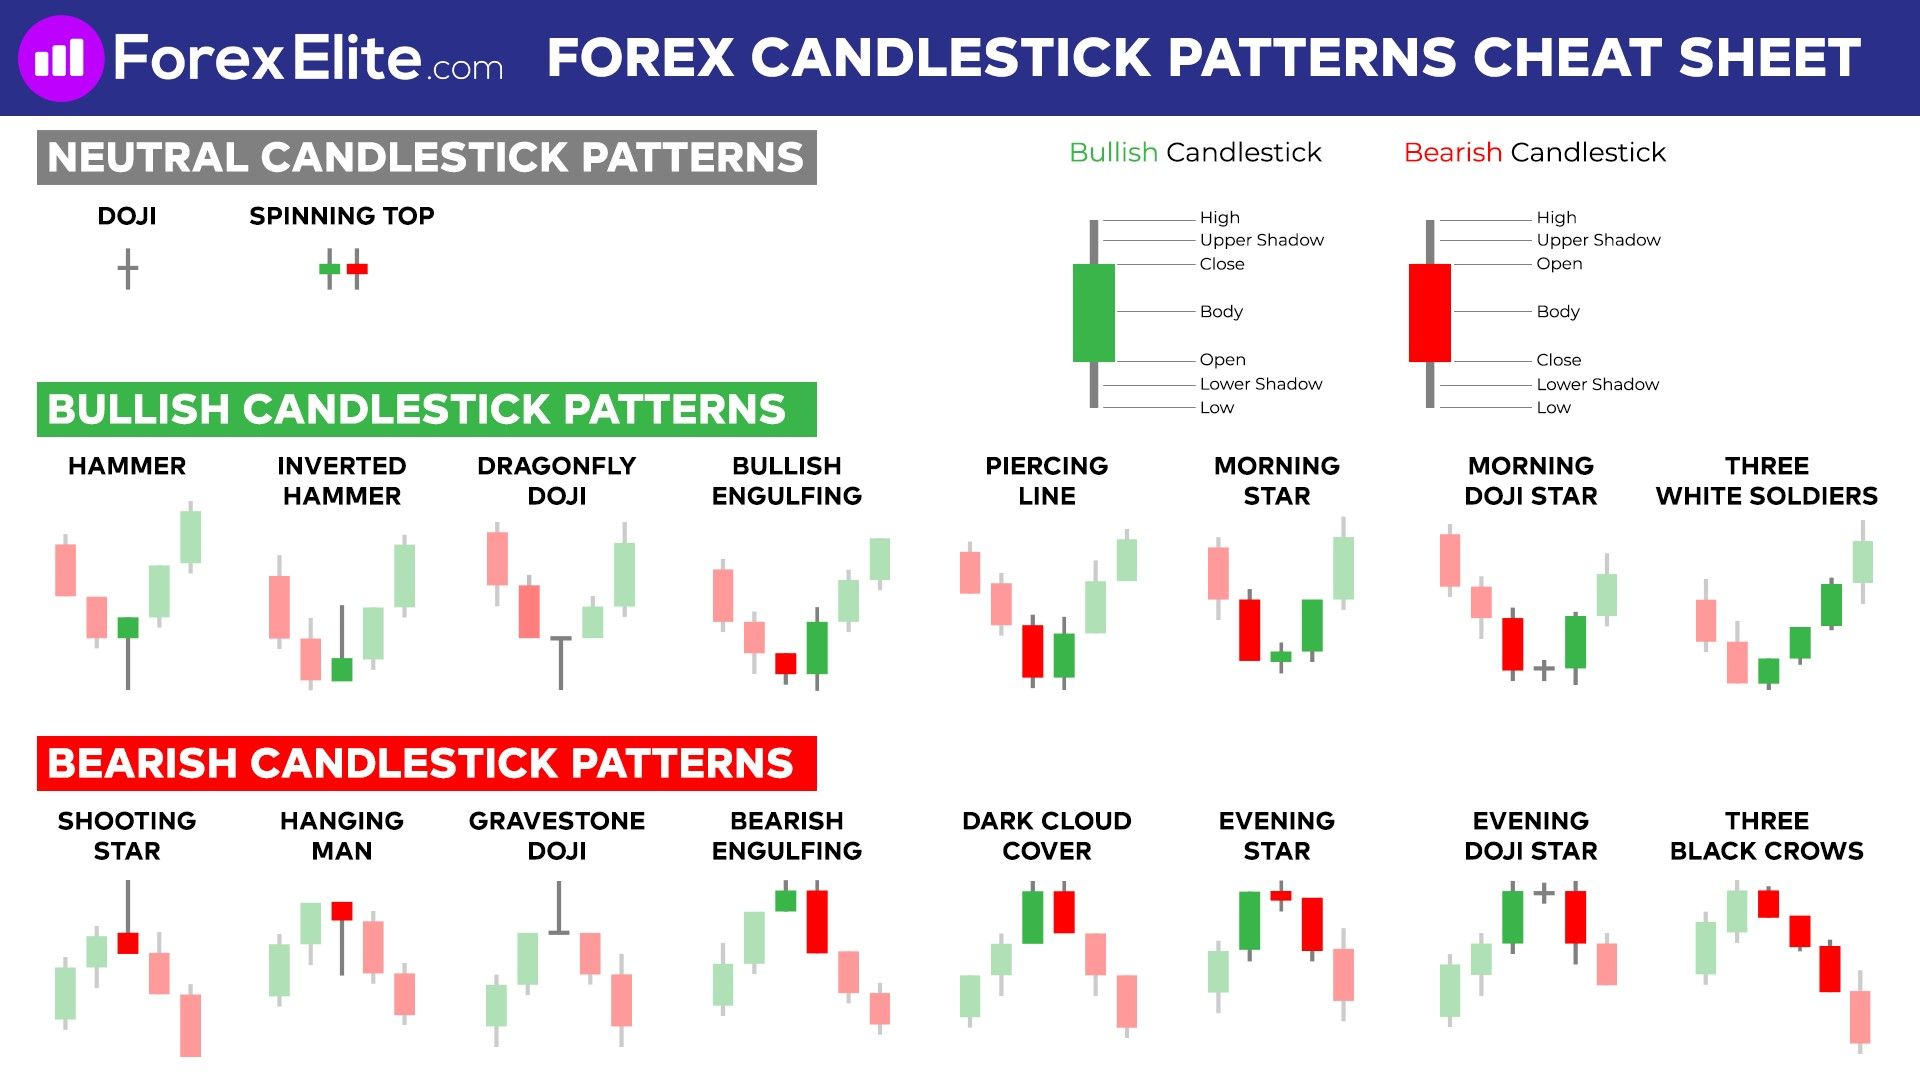
Candlestick Patterns
Candlestick patterns are widely used for their ability to depict market sentiment. Doji, hammer, and engulfing patterns offer valuable clues about potential price reversals or continuation of trends. Traders incorporate these patterns into their analysis to enhance their trading strategies.
Indicators
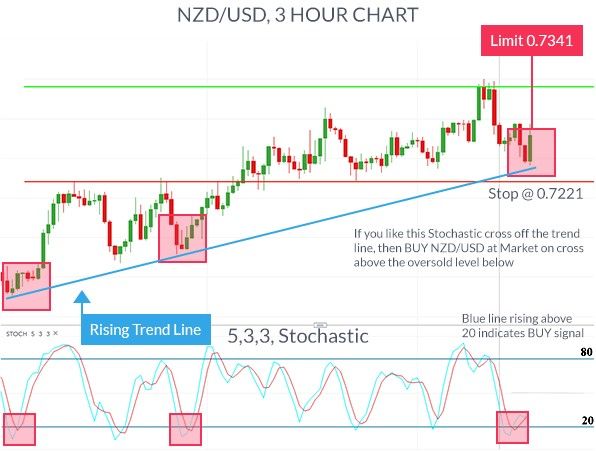
Indicators are essential tools for traders. Popular indicators include the Moving Average (MA), Relative Strength Index (RSI), and Moving Average Convergence Divergence (MACD). Traders leverage these indicators to assess trends, momentum, and overbought or oversold conditions in currency pairs. The choice of indicators depends on a trader's preferred technical strategy and market conditions.
What Are the Phases of Creating a Forex Technical Analysis Strategy?
Determining the Types of the Market and the Trades
Determining the types of markets and trades is a crucial initial phase in creating Forex technical analysis strategies. Traders must assess whether they are dealing with a trending or ranging market. Forex market can exhibit varying characteristics, and understanding the prevailing market conditions is fundamental. Different strategies are employed for trending markets, where traders aim to ride established trends, versus ranging markets, where traders focus on identifying key support and resistance levels for potential reversals.
Choosing Technical Tools
Selecting the appropriate technical tools is paramount for traders. The choice of tools, such as chart patterns, candlestick patterns, and indicators, depends on individual preferences and market conditions. For instance, during periods of high volatility in currency markets, traders may favour volatility-based indicators like Bollinger Bands, while in calmer market environments, trend-following indicators like Moving Averages could be more relevant.
Defining Periods and Other Inputs
Defining time frames and input parameters is crucial for Forex traders. Different traders may opt for short-term, medium-term, or long-term time frames based on their risk tolerance and trading style. For example, day traders may choose shorter time frames, such as 1-hour or 15-minute charts, while swing traders may prefer daily or weekly charts. Additionally, fine-tuning input parameters for indicators, like selecting the appropriate period for a Moving Average, is vital to align the strategy with market conditions.
Searching for Signals
Searching for signals involves precise price charts analysis and usage of chosen technical tools. Traders look for specific patterns or conditions that signal potential entry or exit points. For instance, a trader employing the Relative Strength Index (RSI) might watch for overbought or oversold conditions, while a trader using candlestick patterns might seek reversal or continuation signals.
Executing the Analysis
Executing the analysis is a step where traders put their strategies into action. It involves entering and managing trades based on the signals generated by the technical analysis. Proper risk management is paramount during this phase, as it helps traders protect their capital and navigate the inherently volatile nature of Forex Trading.
Comparing the Results
After executing trades, traders should continuously evaluate the effectiveness of their strategy. This phase involves assessing the outcomes of their trades, analysing the strategy’s performance against predefined goals, and making necessary adjustments. It is essential to maintain a trading journal to track performance and learn from both successful and unsuccessful trades.
Technical Analysis vs. Fundamental Analysis
There is an ongoing debate about the merits of technical analysis versus fundamental analysis. Here are some key points to consider:
Technical Analysis focuses on historical price data and chart patterns. Traders who favour technical analysis believe that all relevant information is already reflected in the price, and by analysing historical price movements and patterns, they can make informed trading decisions. It is especially valuable in short to medium-term trading strategies.
Fundamental Analysis takes into account economic, political, and social factors that can impact currency prices. Traders who prefer fundamental analysis believe that these external factors can provide insights into long-term trends and potential market shifts. It is often used by long-term investors and those looking at macroeconomic trends.
In practice, many traders choose to combine both technical and fundamental analysis to make well-rounded trading decisions. They recognise that each approach has its strengths and weaknesses and that a holistic view of the market can lead to more robust strategies. Ultimately, the choice between technical and fundamental analysis often depends on a trader's individual preferences and their specific trading goals in the dynamic Forex market.
Bottom Line and Key Takeaways
Technical analysis in Forex is an invaluable tool. It provides traders with a systematic approach to understanding price movements, identifying trends, and making informed trading decisions. By following a well-defined strategy and continuously refining it, traders can increase their chances of success in this dynamic market.
Creating a Forex technical analysis strategy follows a structured process that adapts to market conditions. Traders must make informed decisions regarding market types, select appropriate tools, fine-tune parameters, seek signals, execute with risk management, and consistently review and adjust their strategies to achieve success in the dynamic Forex market.
Lloyd has been trading, investing and teaching about financial markets for over a decade. He has a thorough understanding of financial services provider legislation as well as investment asset classes and categories. Lloyd is a certified RE5 representative and holds a COB Investment certificate from the Moonstone Business School of Excellence.
Yes, technical analysis can be a valuable tool for traders of all levels. It provides a structured framework for decision-making.
Regularly reviewing and updating your strategy is advisable, especially in the fast-paced Forex market, where conditions can change rapidly.
While technical analysis is essential, it should be complemented by risk management, a clear trading plan, and consideration of fundamental factors for more comprehensive trading decisions.
Read also


© 2026 BROKSTOCK SA (PTY) LTD.
BROKSTOCK SA (PTY) LTD is an authorised Financial Service Provider and is regulated by the South African Financial Sector Conduct Authority (FSP No.51404). BROKSTOCK SA (PTY) LTD Proprietary Limited trading as BROKSTOCK. BROKSTOCK SA (PTY) LTD t/a BROKSTOCK acts solely as an intermediary in terms of the FAIS Act, rendering only an intermediary service (i.e., no market making is conducted by BROKSTOCK SA (PTY) LTD t/a BROKSTOCK) in relation to derivative products (CFDs) offered by the liquidity providers. Therefore, BROKSTOCK SA (PTY) LTD t/a BROKSTOCK does not act as the principal or the counterparty to any of its transactions.
The materials on this website (the “Site”) are intended for informational purposes only. Use of and access to the Site and the information, materials, services, and other content available on or through the Site (“Content”) are subject to the laws of South Africa.
Risk notice Margin trading in financial instruments carries a high level of risk, and may not be suitable for all users. It is essential to understand that investing in financial instruments requires extensive knowledge and significant experience in the investment field, as well as an understanding of the nature and complexity of financial instruments, and the ability to determine the volume of investment and assess the associated risks. BROKSTOCK SA (PTY) LTD pays attention to the fact that quotes, charts and conversion rates, prices, analytic indicators and other data presented on this website may not correspond to quotes on trading platforms and are not necessarily real-time nor accurate. The delay of the data in relation to real-time is equal to 15 minutes but is not limited. This indicates that prices may differ from actual prices in the relevant market, and are not suitable for trading purposes. Before deciding to trade the products offered by BROKSTOCK SA (PTY) LTD, a user should carefully consider his objectives, financial position, needs and level of experience. The Content is for informational purposes only and it should not construe any such information or other material as legal, tax, investment, financial, or other advice. BROKSTOCK SA (PTY) LTD will not accept any liability for loss or damage as a result of reliance on the information contained within this Site including data, quotes, conversion rates, etc.
Third party content BROKSTOCK SA (PTY) LTD may provide materials produced by third parties or links to other websites. Such materials and websites are provided by third parties and are not under BROKSTOCK SA (PTY) LTD's direct control. In exchange for using the Site, the user agrees not to hold BROKSTOCK SA (PTY) LTD, its affiliates or any third party service provider liable for any possible claim for damages arising from any decision user makes based on information or other Content made available to the user through the Site.
Limitation of liability The user’s exclusive remedy for dissatisfaction with the Site and Content is to discontinue using the Site and Content. BROKSTOCK SA (PTY) LTD is not liable for any direct, indirect, incidental, consequential, special or punitive damages. Working with BROKSTOCK SA (PTY) LTD you are trading share CFDs. When trading CFDs on shares you do not own the underlying asset. Share CFDs are complex instruments and come with a high risk of losing money rapidly due to leverage. A high percentage of retail traders accounts lose money when trading CFDs with their provider. All rights reserved. Any use of Site materials without permission is prohibited.