- What does «Ichimoku Cloud» Mean?
- History of the Ichimoku Cloud
- What's the Purpose of the Ichimoku Cloud?
- What are the Components of the Ichimoku Cloud Indicator?
- What are Ichimoku Cloud Trading Strategies?
- What are the Benefits of Using the Ichimoku Cloud Strategy?
- What are the Drawbacks of Using the Ichimoku Cloud Strategy?
- What are the Rules for Implementing the Ichimoku Cloud Strategy?
- What are the Ichimoku Cloud Trading Signals?
- Example of Trading with the Ichimoku Cloud
- Technical Indicators That Work Best With the Ichimoku Cloud
- Bottom Line and Key Takeaways
The Ichimoku Strategy – What Is It and How to Implement It?

In this article, we’ll delve into the subtleties of the Ichimoku Cloud strategy, a versatile technical analysis tool originating from Japan. We'll explore its definition, delve into its fascinating history, dissect its key components, and weigh up the pros and cons of using this strategy. Also, we'll discuss various trade strategies tailored to the Ichimoku Cloud and outline the significant rules for successfully implementing this powerful indicator in your trade arsenal.
What does «Ichimoku Cloud» Mean?
The Ichimoku Cloud, also known as Ichimoku Kinko Hyo, is a comprehensive indicator that provides insights into an asset's direction, momentum, and possible support and resistance levels. Originating from Japan, «Ichimoku» translates to «one glance», emphasising its ability to grant a holistic view of market conditions in a single chart.
History of the Ichimoku Cloud
The history of the Ichimoku Cloud dates back to the late 1930s when Japanese journalist Goichi Hosoda developed and then in 1968 published this innovative technical analysis tool. However, its global recognition came much later, primarily in the late 20th century, as global financial markets expanded and became more interconnected. Traders and investors began to examine various technical analysis methods to navigate the intricacies of the financial markets, leading to the gradual acceptance and integration of the Ichimoku Cloud into their trading strategies. Over time, the Ichimoku Cloud has become an essential asset for investors.
What's the Purpose of the Ichimoku Cloud?
The primary purpose of the Ichimoku Cloud for investors is to grant a comprehensive framework for analysing market dynamics and making good trade decisions. The Ichimoku Cloud offers a versatile tool that can be applied across different asset classes and timeframes. By integrating multiple components, the Ichimoku Cloud enables investors to determine trends, gauge market sentiment, and pinpoint potential entry and exit points. Whether trading on the Johannesburg Stock Exchange (JSE) or participating in the global Forex Market, investors rely on the Ichimoku Cloud to navigate volatile market conditions and enhance their overall trade performance.
What are the Components of the Ichimoku Cloud Indicator?
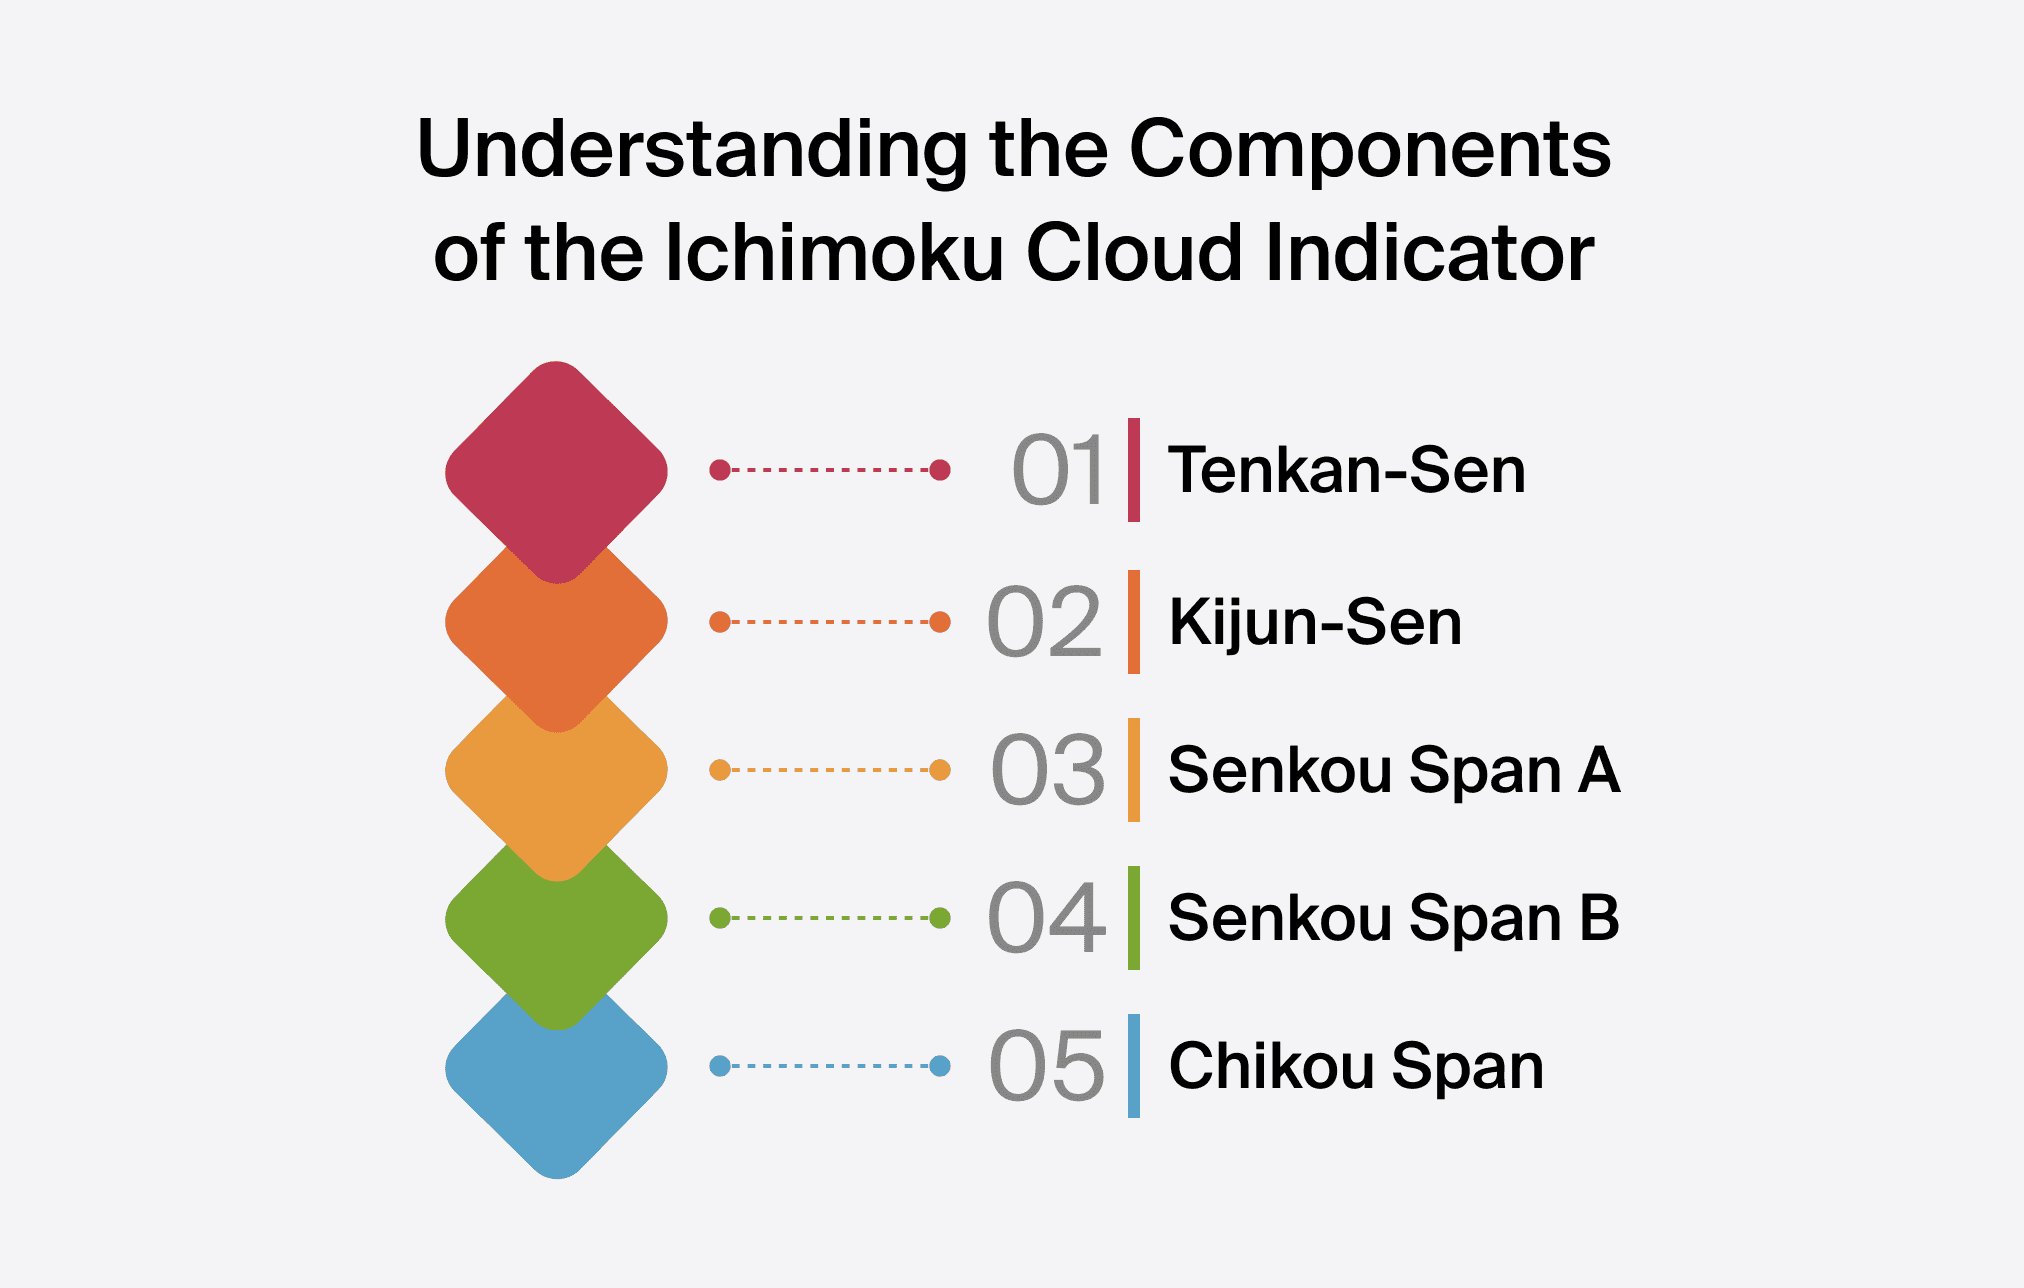
Understanding the components of the Ichimoku Cloud indicator is important for effective technical analysis and trading decisions. Here are the key components:
Tenkan Sen (Conversion Line)
This line is calculated as the average of the highest high and the lowest low over the past nine periods. It provides insight into short-term price momentum.
Kijun Sen (Base Line)
The Kijun Sen is calculated as the average of the highest high and the lowest low over the past 26 periods. It serves as a measure of medium-term price momentum and potential support or resistance levels.
Senkou Span A (Leading Span A) and Senkou Span B (Leading Span B)
Senkou Span A is calculated as the average of the Tenkan Sen and Kijun Sen, plotted 26 periods ahead. Senkou Span B is calculated as the average of the highest high and lowest low over the past 52 periods, also plotted 26 periods ahead. Together, these lines form the Kumo Cloud, which represents future potential support and resistance zones. The thickness and colour of the Kumo Cloud provide visual cues about the strength of the trend and possible trade opportunities.
Chikou Span (Lagging Span)
The Chikou Span is the current closing price plotted 26 periods in the past. It helps traders assess the strength of the current trend by comparing it to past price action.
What are Ichimoku Cloud Trading Strategies?
Various Ichimoku Cloud trading strategies cater to different trading styles and objectives. Here are three commonly employed strategies:
Trend-Following Strategy
Traders frequently utilise the Ichimoku Cloud to determine and follow prevailing trends. By observing the positioning of price relative to the Kumo Cloud and the alignment of Tenkan Sen and Kijun Sen, traders aim to enter trades in the direction of the dominant trend. This strategy is particularly effective in trending markets, allowing traders to ride the momentum and capture substantial profits.
Breakout Strategy
Breakout trading is popular among investors seeking to capitalise on significant price movements. With the Ichimoku Cloud, traders determine key support and resistance levels within the Kumo Cloud. Breakouts above or below these levels, accompanied by strong volume and confirmation from other indicators, signal possible trade opportunities. This strategy enables traders to enter trades early in emerging trends, maximising profit potential.
Reversal Strategy
Recognising trend reversals is essential for traders aiming to enter positions opportunistically. The Ichimoku Cloud provides valuable insights into possible trend reversals through signals such as Kumo twists and Chikou Span crossovers. Traders wait for confirmation of reversal patterns, such as the price crossing above or below the Kumo Cloud, before opening trades in the opposite direction of the previous trend. This strategy allows traders to capture profits from market turning points while minimising risks.
What are the Benefits of Using the Ichimoku Cloud Strategy?
Traders derive some advantages from employing the Ichimoku Cloud trading strategy:
- Versatility: The Ichimoku Cloud can be applied across different financial instruments and timeframes, making it suitable for diverse trading styles and market states.
- Simplicity: Despite its comprehensive nature, the Ichimoku Cloud grants a straightforward visual presentation of market trends and possible trade opportunities, simplifying the decision-making process for traders.
- Compatibility: The Ichimoku Cloud strategy supplements other technical indicators and trade strategies usually utilised by investors, enhancing their general trade effectiveness and performance.
What are the Drawbacks of Using the Ichimoku Cloud Strategy?
While the Ichimoku Cloud strategy grants numerous benefits, traders should be aware of possible drawbacks:
- Variety: The multitude of components and signals within the Ichimoku Cloud may overwhelm beginning traders, requiring time and effort to fully grasp its intricacies and effectively implement the strategy.
- Congestion: In periods of low volatility or sideways markets, the Kumo Cloud may become flat or congested, leading to lying signals and increased risk of whipsaws for traders who rely only on the Ichimoku Cloud strategy.
Despite these drawbacks, with proper education, practice, and integration with other technical analysis tools, traders can mitigate risks and capitalise on the strengths of the Ichimoku Cloud strategy in their trade endeavours.
What are the Rules for Implementing the Ichimoku Cloud Strategy?
Executing the Ichimoku Cloud strategy demands adherence to a specific set of rules to maximise effectiveness and mitigate risks. Here are the fundamental rules:
Let the Price Break Through and Close above the Ichimoku Cloud
Before considering a long position, traders should wait for the price to break through and close above the Kumo Cloud. This confirms bullish momentum and signals a potential uptrend.
Wait for the Conversion to Cross Above the Base Line
Once the price closes above the Kumo Cloud, traders should watch for the Tenkan Sen crossing above the Kijun Sen. This crossover validates the bullish signal and points to a strengthening upward trend.
Buy After the Crossover at the Next Candle's Opening
To start a long position, traders should wait for the next candle's opening after the crossover of the Tenkan Sen and Kijun Sen. This ensures confirmation of the bullish momentum and minimises the risk of lying signals.
Place a Stop-Loss Order Beneath the Breakout Candle
To manage risk, traders must set a stop-loss order below the low of the breakout candle. This aids in protecting against possible downside risk in case the market reverses unexpectedly.
Take Profit When the Conversion Line Falls Below the Base Line
Investors must consider taking profits when the Tenkan Sen falls below the Kijun Sen. This crossover assumes a weakening of bullish momentum and can point to a possible reversal of the trend, encouraging investors to exit their positions with gains.
By following these rules meticulously, investors can efficiently utilise the Ichimoku Cloud strategy to determine high-probability trade possibilities and optimise their risk-reward ratio.
What are the Ichimoku Cloud Trading Signals?
Understanding Ichimoku trading signals is important for the effective process of making decisions. Here are the key signals:
Bullish and Bearish Signals
The Ichimoku Cloud grants clear signals for bullish and bearish market conditions. A bullish signal occurs when the price is above the Kumo Cloud, while a bearish signal occurs when the price is below the Kumo Cloud. These signals point to the predominant market sentiment and aid investors in aligning their positions with the direction of the trend.
Tenkan-Sen and Kijun-Sen Crossovers
Crossovers between the Tenkan Sen and Kijun Sen produce essential trade signals. A bullish crossover occurs when the Tenkan Sen crosses above the Kijun Sen, which signals a potential buying possibility. A bearish crossover points to a potential selling possibility. These crossovers highlight changes in short to medium-term momentum and aid investors in determining entry and exit points.
Senkou Span Crossovers
Crossovers between Senkou Span A and Senkou Span B, forming the Kumo Cloud, grant essential trade signals, too. When Senkou Span A crosses above Senkou Span B, it produces a bullish signal that assumes increasing bullish momentum. A crossover where Senkou Span A crosses below Senkou Span B points to a bearish signal, signalling a possible change in market sentiment. These crossovers help traders confirm trend directions and anticipate potential trend reversals.
Example of Trading with the Ichimoku Cloud
Let's consider an example of Ichimoku trading:
Scenario: A trader is analysing the performance of a stock listed on the JSE, looking for potential trading opportunities using the Ichimoku Cloud strategy.
Example Trade:
- Analysis: The trader observes that the stock's price has recently broken above the Kumo Cloud, signalling a bullish trend reversal. Additionally, the Tenkan Sen has crossed above the Kijun Sen, providing further confirmation of bullish momentum.
- Entry: As per the Ichimoku Cloud strategy rules, the trader waits for the next candle's opening after the crossover of Tenkan Sen and Kijun Sen to enter a long position.
- Trade Execution: The trader enters a long position at the opening of the next candle, aligning with the bullish signals provided by the Ichimoku Cloud indicators.
- Risk Management: To manage risk, the trader sets a stop-loss order below the low of the breakout candle, ensuring protection against potential downside risk.
- Take Profit: The trader sets a take-profit level based on the distance to the next significant resistance level or based on the Ichimoku Cloud components, such as when the Tenkan Sen falls below the Kijun Sen, signalling a potential trend reversal.
- Monitoring: The trader monitors the trade closely, considering adjustments to the stop-loss and take-profit levels as the trade progresses and new signals emerge from the Ichimoku Cloud indicators.
- Exit: The trader exits the trade when the take-profit level is reached.
Adding the Ichimoku Cloud Indicator to the Chart in MT4
MetaTrader 4 (MT4) is a widely used trading platform, and adding the Ichimoku Cloud indicator can enhance traders' analysis capabilities. Here's how traders can add the Ichimoku Cloud indicator to MT4:
- Open the MT4 Platform: Launch the MT4 platform on your computer or mobile device.
- Access the Navigator Window: Locate the Navigator window on the left side of the platform. If it's not visible, you can enable it by clicking "View" in the top menu and selecting “Navigator”.
- Locate Indicators: In the Navigator window, expand the «Indicators» section by clicking on the small arrow icon next to it.
- Find the Ichimoku Cloud Indicator: Scroll down or use the search function to find the «Ichimoku Kinko Hyo» indicator. Double-click on it or drag it onto the chart you wish to apply it to.
- Adjust Settings (Optional): A dialogue box will appear, allowing you to adjust the settings of the Ichimoku Cloud indicator, including customising colours and line styles. You can modify these settings based on your preferences or leave them as default.
- Confirm and Apply: Once you've adjusted the settings (if necessary), click «OK» to apply the Ichimoku Cloud indicator to the chart.
- Interpret the Indicator: After adding the indicator, familiarise yourself with how it interacts with price action and other technical analysis tools. This will enable you to make informed trading decisions based on Ichimoku Cloud signals.
Technical Indicators That Work Best With the Ichimoku Cloud
Combining the Ichimoku Cloud indicator with complementary technical indicators can provide a more robust analysis framework. Here are some technical indicators that work well in conjunction with the Ichimoku Cloud:
Moving Averages
Simple Moving Averages (SMA) or Exponential Moving Averages (EMA) can complement the Ichimoku Cloud by providing additional confirmation of trend direction and potential support or resistance levels.
Relative Strength Index (RSI)
The RSI helps traders assess the strength of price movements. When combined with the Ichimoku Cloud, divergences between RSI and price action can signal potential trend reversals or continuations.
Moving Average Convergence Divergence (MACD)
MACD is effective in identifying changes in momentum and trend direction. Crossover signals and divergence patterns can offer valuable insights into market dynamics when used alongside the Ichimoku Cloud.
Volume Indicators
Incorporating volume indicators such as On-Balance Volume (OBV) or Volume Weighted Average Price (VWAP) can validate signals generated by the Ichimoku Cloud, especially during breakout or reversal scenarios.
Fibonacci Retracement Levels
Fibonacci retracement levels serve as potential support or resistance zones. When aligned with key levels identified by the Ichimoku Cloud, traders can anticipate price reactions and adjust their trading strategies accordingly.
By integrating these complementary technical indicators with the Ichimoku strategy, traders can enhance the accuracy of their analysis.
Bottom Line and Key Takeaways
The Ichimoku Cloud indicator is a powerful tool for investors seeking to navigate the complexities of financial markets. By understanding its components and implementing appropriate trading strategies, investors can enhance their decision-making process and improve their overall trading performance.
Lloyd has been trading, investing and teaching about financial markets for over a decade. He has a thorough understanding of financial services provider legislation as well as investment asset classes and categories. Lloyd is a certified RE5 representative and holds a COB Investment certificate from the Moonstone Business School of Excellence.
Yes, the Ichimoku Cloud can be applied to various markets, including stocks, forex, commodities, and cryptocurrencies.
Absolutely, integrating the Ichimoku Cloud with other indicators can provide additional confirmation and enhance trading decisions.
While the Ichimoku trading strategy may seem complex at first, with practice and dedication, beginners can grasp its concepts and effectively incorporate it into their trading playbook.
Read also


© 2026 BROKSTOCK SA (PTY) LTD.
BROKSTOCK SA (PTY) LTD is an authorised Financial Service Provider and is regulated by the South African Financial Sector Conduct Authority (FSP No.51404). BROKSTOCK SA (PTY) LTD Proprietary Limited trading as BROKSTOCK. BROKSTOCK SA (PTY) LTD t/a BROKSTOCK acts solely as an intermediary in terms of the FAIS Act, rendering only an intermediary service (i.e., no market making is conducted by BROKSTOCK SA (PTY) LTD t/a BROKSTOCK) in relation to derivative products (CFDs) offered by the liquidity providers. Therefore, BROKSTOCK SA (PTY) LTD t/a BROKSTOCK does not act as the principal or the counterparty to any of its transactions.
The materials on this website (the “Site”) are intended for informational purposes only. Use of and access to the Site and the information, materials, services, and other content available on or through the Site (“Content”) are subject to the laws of South Africa.
Risk notice Margin trading in financial instruments carries a high level of risk, and may not be suitable for all users. It is essential to understand that investing in financial instruments requires extensive knowledge and significant experience in the investment field, as well as an understanding of the nature and complexity of financial instruments, and the ability to determine the volume of investment and assess the associated risks. BROKSTOCK SA (PTY) LTD pays attention to the fact that quotes, charts and conversion rates, prices, analytic indicators and other data presented on this website may not correspond to quotes on trading platforms and are not necessarily real-time nor accurate. The delay of the data in relation to real-time is equal to 15 minutes but is not limited. This indicates that prices may differ from actual prices in the relevant market, and are not suitable for trading purposes. Before deciding to trade the products offered by BROKSTOCK SA (PTY) LTD, a user should carefully consider his objectives, financial position, needs and level of experience. The Content is for informational purposes only and it should not construe any such information or other material as legal, tax, investment, financial, or other advice. BROKSTOCK SA (PTY) LTD will not accept any liability for loss or damage as a result of reliance on the information contained within this Site including data, quotes, conversion rates, etc.
Third party content BROKSTOCK SA (PTY) LTD may provide materials produced by third parties or links to other websites. Such materials and websites are provided by third parties and are not under BROKSTOCK SA (PTY) LTD's direct control. In exchange for using the Site, the user agrees not to hold BROKSTOCK SA (PTY) LTD, its affiliates or any third party service provider liable for any possible claim for damages arising from any decision user makes based on information or other Content made available to the user through the Site.
Limitation of liability The user’s exclusive remedy for dissatisfaction with the Site and Content is to discontinue using the Site and Content. BROKSTOCK SA (PTY) LTD is not liable for any direct, indirect, incidental, consequential, special or punitive damages. Working with BROKSTOCK SA (PTY) LTD you are trading share CFDs. When trading CFDs on shares you do not own the underlying asset. Share CFDs are complex instruments and come with a high risk of losing money rapidly due to leverage. A high percentage of retail traders accounts lose money when trading CFDs with their provider. All rights reserved. Any use of Site materials without permission is prohibited.