What Is The Best Forex Indicator Combination?

In the realm of Forex Trading, intraday indicators hold substantial significance for traders in South Africa and around the world. In this guide, we will delve into the concept of intraday indicators, explore their importance and examples. Also, we will try to find the best trading indicator combination to empower traders in making profitable decisions.
What do Intraday Indicators Mean?
Intraday indicators are technical analysis tools tailored for the fast-paced nature of trading. They assist traders in understanding the price dynamics within one day. By utilising these indicators, traders can assess market conditions, recognise trends, and make accurate entry and exit decisions.
What is the Importance of Intraday Indicators?
Intraday indicators play a key role in Forex Trading for several reasons:
Trend Indication
They help traders determine the predominant market direction. This is crucial for making decisions on whether to buy or sell a currency pair. In a Market as dynamic as Forex, recognising trends is essential.
Momentum Indication
Momentum indicators like the Relative Strength Index (RSI) submit insights into the speed and strength of price movements. In a volatile market, understanding momentum is vital for pinpointing entry and exit points.
Volume Indication
These help traders in assessing market participation. A spike in trading volume can signal increased interest and potentially reveal the authenticity of a price move.
Volatility Indication
Given the ever-changing nature of Forex Markets, volatility indicators like Bollinger Bands assist traders in gauging price fluctuations. This information is invaluable for setting stop-loss and take-profit levels.
Overbought or Oversold Conditions Indication
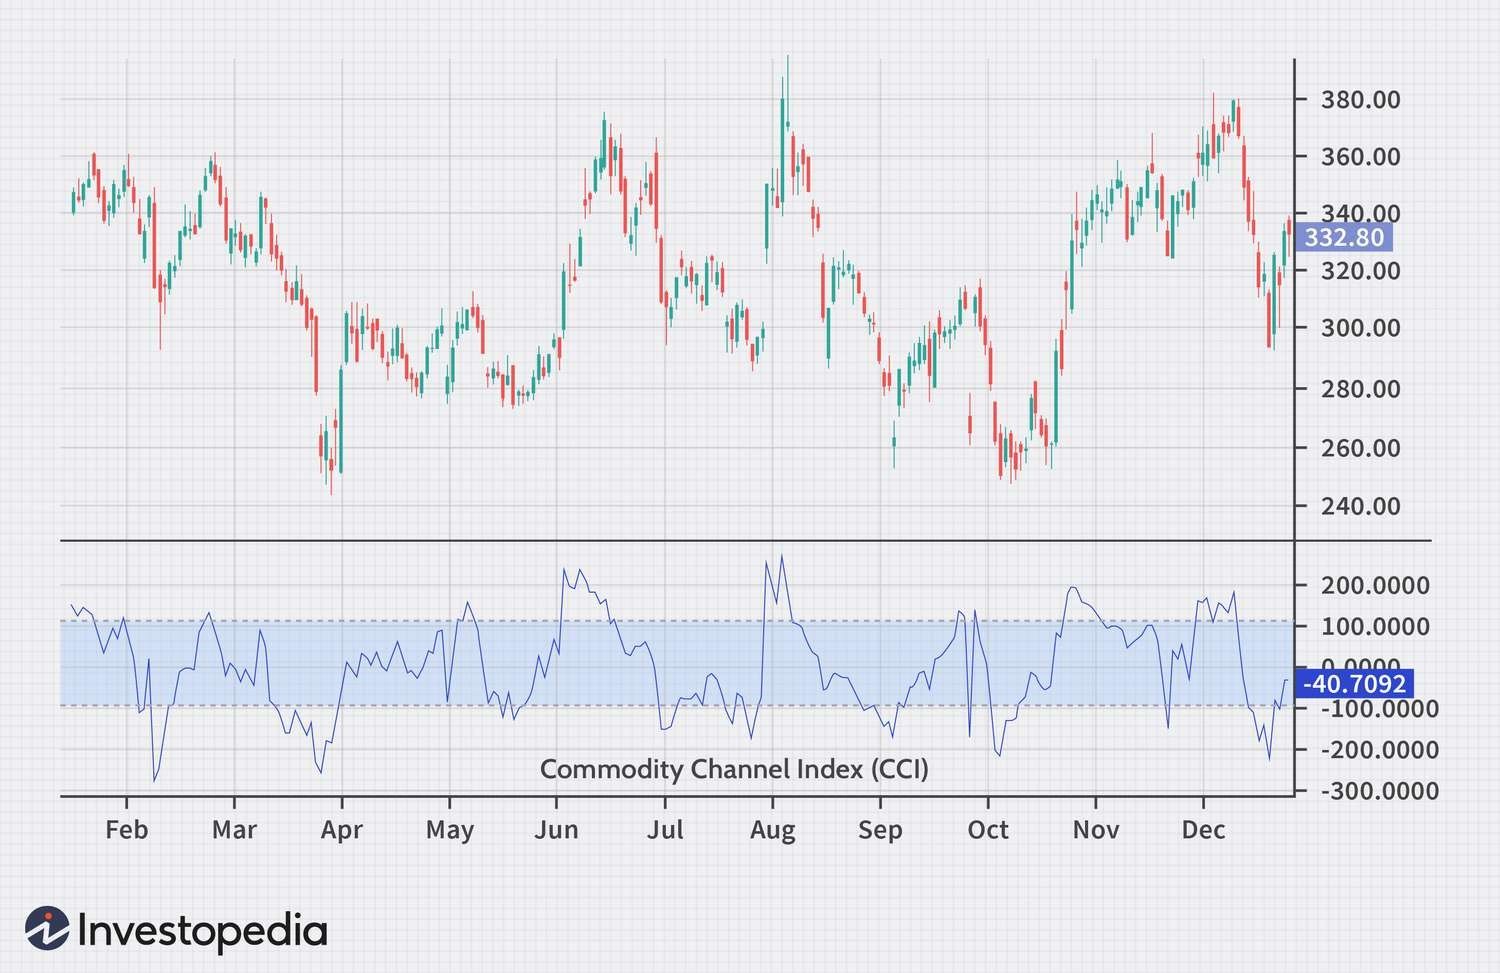
Oscillators, such as the Stochastic Oscillator and Commodity Channel Index (CCI), help in determining overbought and oversold conditions. Understanding when a currency pair is at these extremes can be instrumental in predicting potential reversals.
What are the Examples of the Best Intraday Indicators?
Traders can leverage various intraday indicators to improve their decision-making process. Some best indicators for Intraday Trading comprise:
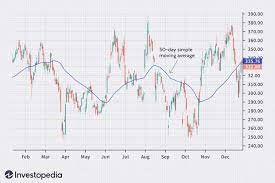
Moving Averages
Moving Averages are often utilised to determine trends. The Simple Moving Average (SMA) and Exponential Moving Average (EMA) are well-known choices among traders. The SMA calculates the average of a set of data points within a specified time window or interval. And the EMA places more weight on recent data points, giving them greater significance in the calculation. It's calculated using a formula that exponentially weights each data point.
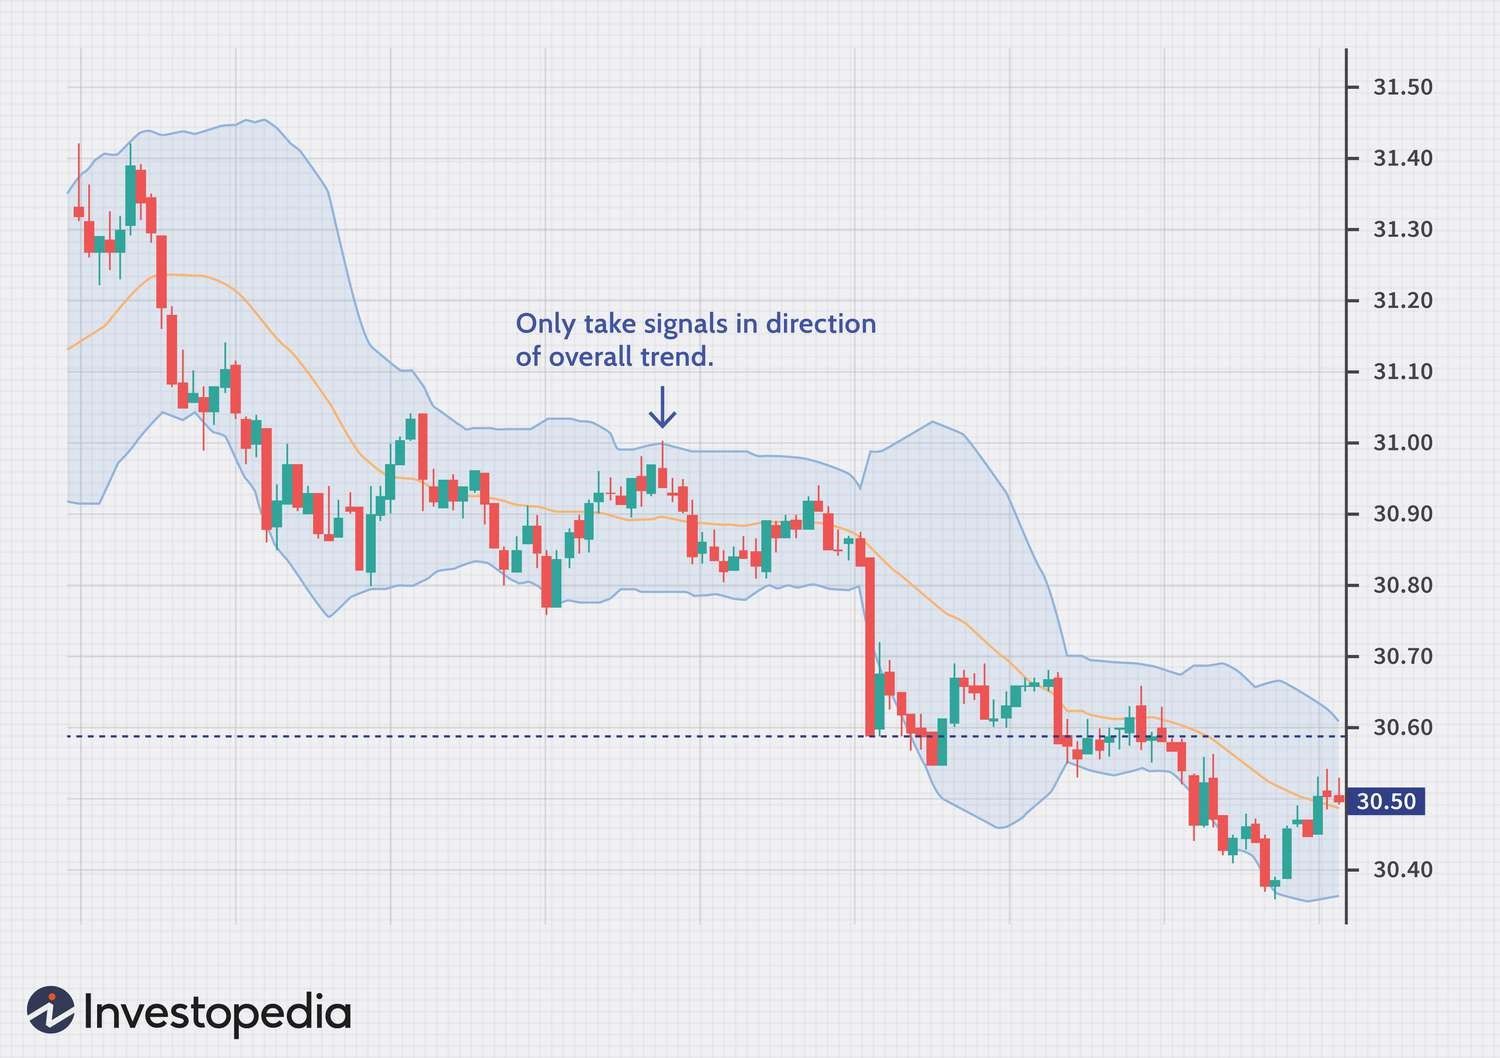
Bollinger Bands
These indicators aid traders in assessing price volatility and potential reversal points. In a market as fluid as Forex, Bollinger Bands are indispensable.
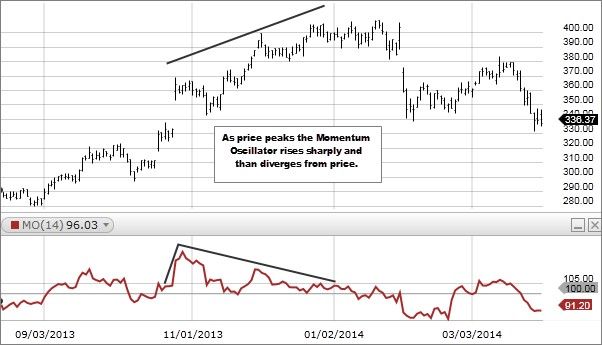
Momentum Oscillators
The Moving Average Convergence Divergence (MACD) and RSI are examples of momentum indicators. They submit insights into the strength and speed of price movements, aiding traders in making timely decisions.
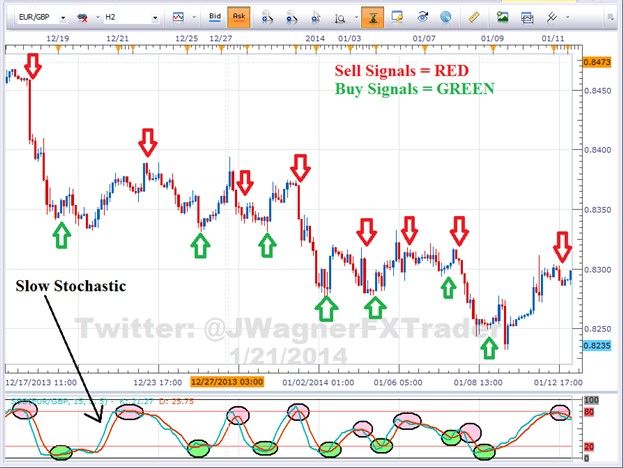
Stochastic Oscillator
The Stochastic Oscillator is invaluable for recognizing overbought and oversold conditions in markets. Traders may utilise it to gauge possible reversals and entry/exit points.
Commodity Channel Index
CCI is a momentum oscillator that measures the deviation of a currency pair's price from its statistical average. Traders utilise CCI to spot possible overbought and oversold conditions, similar to the Stochastic Oscillator.
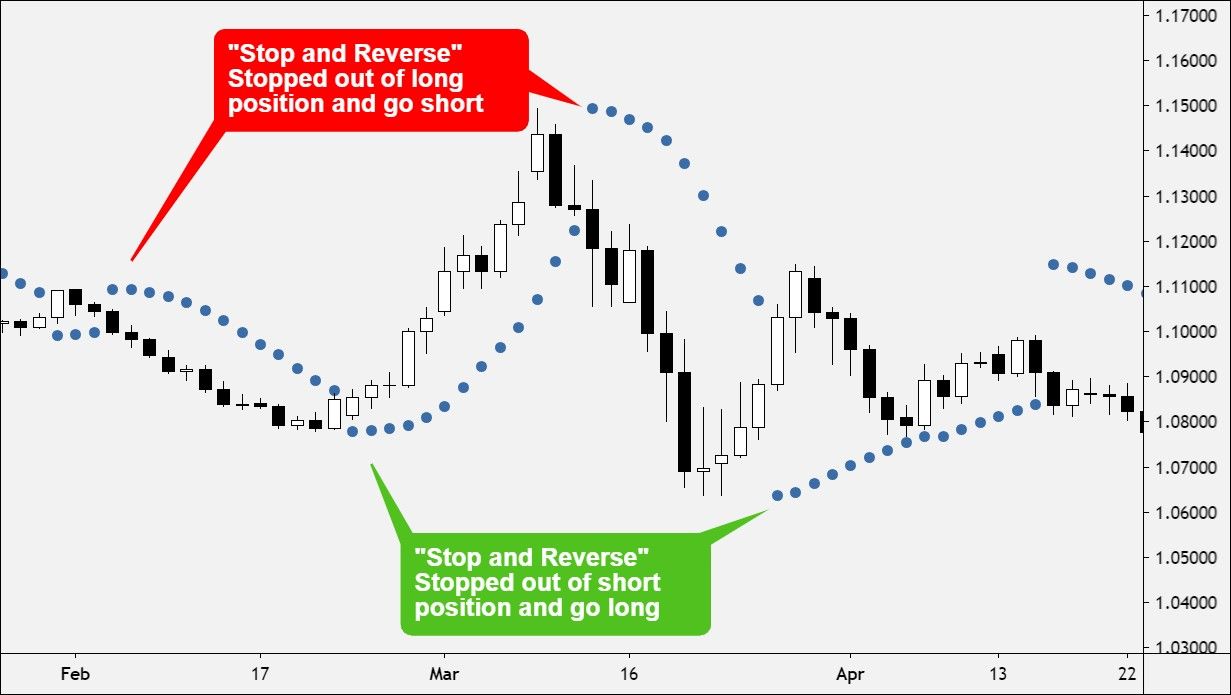
Parabolic Stop and Reverse (SAR)
Parabolic SAR is a popular indicator among traders, signalling possible trend reversals with dots appearing above or below price candles. This tool aids traders in setting effective stop-loss levels and making gainful decisions regarding trend continuations or reversals.
Fibonacci Retracement Levels
Fibonacci Retracement Levels offer key support and resistance levels for traders. These levels, derived from the Fibonacci Sequence, aid in defining possible entry and exit points. Traders utilise this tool to analyse price retracements and extensions, gaining insights into the market's likely reversal and continuation points.
What is the Best Combination of Indicators for Day Trading?
The effectiveness of intraday indicator combination depends on market conditions, the trader's strategy, and risk management. Traders should thoroughly understand how each indicator works and practice using them in various scenarios before applying them to their real trading activities. Here are the best combinations of intraday indicators:
Moving Average + Stochastic
This combination is effective for traders looking to determine trends and possible entry/exit points. Moving Averages smooth out price data, making it easier to spot trends, while the Stochastic Oscillator aids in determining overbought and oversold conditions, signalling potential reversals.
Bollinger Bands + Stochastic
Traders frequently utilise this combination to gauge volatility and overbought/oversold conditions. Bollinger Bands provide a visual representation of price volatility, while the Stochastic Oscillator helps identify entry/exit points, especially when the price is at extreme levels.
MACD + RSI
Combining the MACD and RSI is a powerful duo for comprehensive trend and momentum analysis. MACD provides insights into trend direction and momentum, while RSI helps gauge the strength of price movements. Together, they offer a holistic view of market conditions.
Parabolic SAR + EMA
Traders can use this combination to identify potential trend changes and reversal points. The Parabolic SAR is particularly useful for trend-following, while the EMA provides dynamic support and resistance levels.
Parabolic SAR + Stochastic
This combination is beneficial for traders seeking to spot trend changes and overbought/oversold conditions. The Parabolic SAR helps identify trend reversals, while the Stochastic Oscillator assists in pinpointing entry/exit points.
Fibonacci Retracement Levels + MACD
Traders looking for a comprehensive analysis of trends, momentum, and potential reversals often use this combination. Fibonacci Retracement Levels help identify key support and resistance levels, while the MACD complements this by providing insights into trend direction and strength.
Bottom Line and Key Takeaways
Understanding and harnessing the power of intraday indicators is essential for successful Forex Trading. The best combination of technical indicators can provide traders with a holistic view of market dynamics, aiding in the identification of trends, reversals, and entry/exit points. However, it's important to remember that no indicator is infallible, and risk management remains a critical aspect.
Maboko brings over 10 years of automated technical analysis and 6+ years of financial market experience to BROKSTOCK. He covers a wide variety of instruments to help investors achieve their long-term and retirement goals. Through his educational content and in-depth analytical analysis, Maboko breaks down complex market data into clear, actionable strategies for sustainable investing.
While these combinations are popular and widely used, their effectiveness depends on market conditions and individual trading strategies. It's essential to backtest and adapt them as needed.
Most trading platforms offer these indicators as built-in tools. Traders can add them to their charts and customise their settings.
Traders can benefit from educational resources, online courses, and practice accounts to hone their skills and understand the nuances of each indicator.
Read also


© 2026 BROKSTOCK SA (PTY) LTD.
BROKSTOCK SA (PTY) LTD is an authorised Financial Service Provider and is regulated by the South African Financial Sector Conduct Authority (FSP No.51404). BROKSTOCK SA (PTY) LTD Proprietary Limited trading as BROKSTOCK. BROKSTOCK SA (PTY) LTD t/a BROKSTOCK acts solely as an intermediary in terms of the FAIS Act, rendering only an intermediary service (i.e., no market making is conducted by BROKSTOCK SA (PTY) LTD t/a BROKSTOCK) in relation to derivative products (CFDs) offered by the liquidity providers. Therefore, BROKSTOCK SA (PTY) LTD t/a BROKSTOCK does not act as the principal or the counterparty to any of its transactions.
The materials on this website (the “Site”) are intended for informational purposes only. Use of and access to the Site and the information, materials, services, and other content available on or through the Site (“Content”) are subject to the laws of South Africa.
Risk notice Margin trading in financial instruments carries a high level of risk, and may not be suitable for all users. It is essential to understand that investing in financial instruments requires extensive knowledge and significant experience in the investment field, as well as an understanding of the nature and complexity of financial instruments, and the ability to determine the volume of investment and assess the associated risks. BROKSTOCK SA (PTY) LTD pays attention to the fact that quotes, charts and conversion rates, prices, analytic indicators and other data presented on this website may not correspond to quotes on trading platforms and are not necessarily real-time nor accurate. The delay of the data in relation to real-time is equal to 15 minutes but is not limited. This indicates that prices may differ from actual prices in the relevant market, and are not suitable for trading purposes. Before deciding to trade the products offered by BROKSTOCK SA (PTY) LTD, a user should carefully consider his objectives, financial position, needs and level of experience. The Content is for informational purposes only and it should not construe any such information or other material as legal, tax, investment, financial, or other advice. BROKSTOCK SA (PTY) LTD will not accept any liability for loss or damage as a result of reliance on the information contained within this Site including data, quotes, conversion rates, etc.
Third party content BROKSTOCK SA (PTY) LTD may provide materials produced by third parties or links to other websites. Such materials and websites are provided by third parties and are not under BROKSTOCK SA (PTY) LTD's direct control. In exchange for using the Site, the user agrees not to hold BROKSTOCK SA (PTY) LTD, its affiliates or any third party service provider liable for any possible claim for damages arising from any decision user makes based on information or other Content made available to the user through the Site.
Limitation of liability The user’s exclusive remedy for dissatisfaction with the Site and Content is to discontinue using the Site and Content. BROKSTOCK SA (PTY) LTD is not liable for any direct, indirect, incidental, consequential, special or punitive damages. Working with BROKSTOCK SA (PTY) LTD you are trading share CFDs. When trading CFDs on shares you do not own the underlying asset. Share CFDs are complex instruments and come with a high risk of losing money rapidly due to leverage. A high percentage of retail traders accounts lose money when trading CFDs with their provider. All rights reserved. Any use of Site materials without permission is prohibited.