


JSE & NYSE Shares Analysis 3 - 7 August 2026

Naspers Ltd.(NPN): Naspers operates as an Internet and media group.
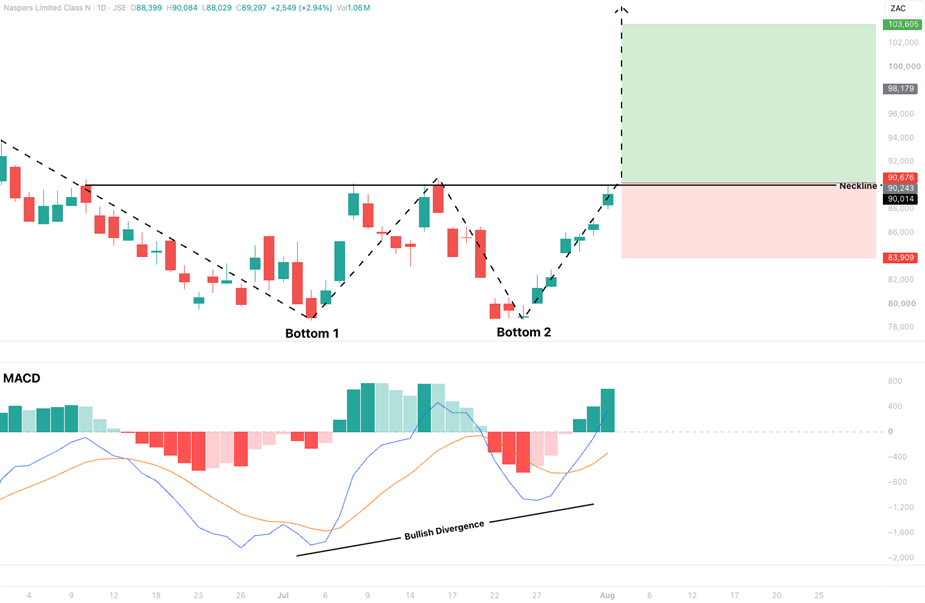
A double bottom is unfolding. The price tested the same support level twice and sellers failed to break it, signalling downside exhaustion. A decisive close above the R900 neckline confirms the pattern and opens the way higher. The moving average convergence divergence (MACD) adds weight: a bullish divergence formed at the second low, showing selling pressure fading, and a bullish crossover has since followed. Momentum now favours upward movement. Wait for the confirmed close above R900 before acting.
A potential Buy/Long idea can be initiated once price closes above R900, with the target set at R1036.05 and stop loss at R839.09.
Datatec Ltd. (DTC): Datatec is in the business of developing and providing information and communication technology solutions and services.
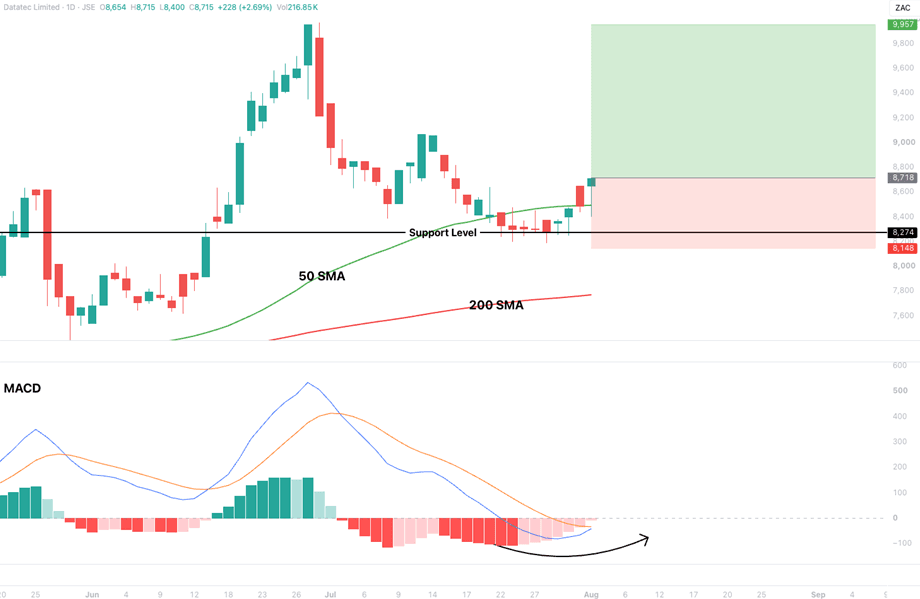
This is a classical trend continuation setup. Price pulled back to test the 50-day simple moving average (SMA) and closed back above it. The moving average held as support, showing the uptrend's buyers stepped in on the dip. The price is also trading above the 200-day SMA, confirming the pullback was a pause rather than a reversal. The MACD is now poised for a bullish crossover, signalling momentum is turning back up in the direction of the trend.
A potential Buy/Long idea can be initiated, with the target set at R99.57 and stop loss at R81.48.
Gold Fields Ltd.(GFI): Gold Fields is a gold mining company, which is involved in the production of gold and operation of mines.
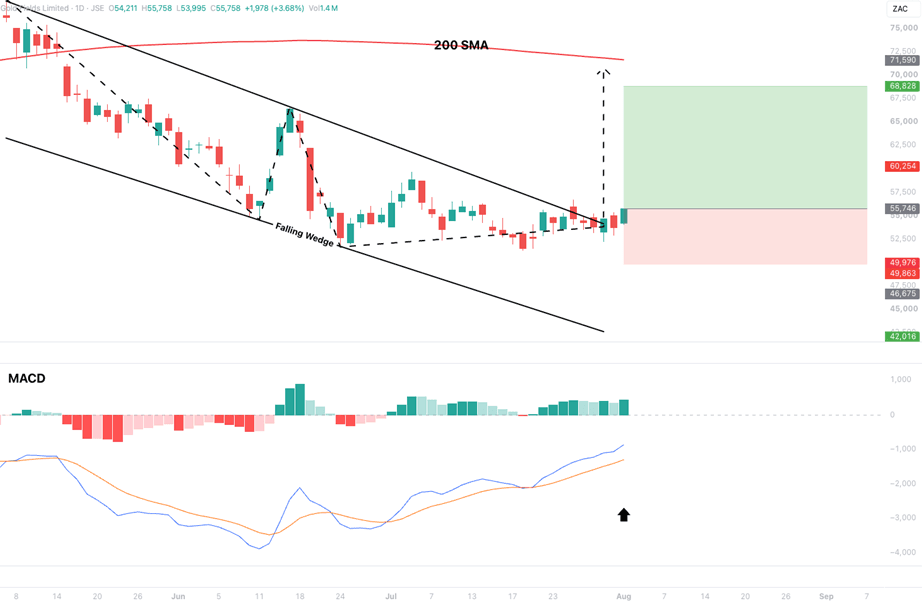
Price has broken out of a falling wedge, a bullish reversal pattern where the narrowing downtrend gives way to an upside break, signalling sellers are losing their grip. The MACD is already in positive momentum and has room to run further before reaching overbought territory, supporting the case for continued upside in the near term. Worth noting, however, that the share is still trading below its 200-day SMA, which tells us the long-term trend remains bearish and bears are in charge of the broader picture. So this is a countertrend bounce; manage risk accordingly.
A potential Buy/Long idea can be initiated, with the target set at R688.28 and stop loss at R499.76.
CoreWeave, Inc. (CRWV): CoreWeave is in the business of creating power and delivering the intelligence that drives innovation. It offers a solution used by organisations that require sophisticated AI computing, from the largest of enterprises to small, well-funded start-ups.
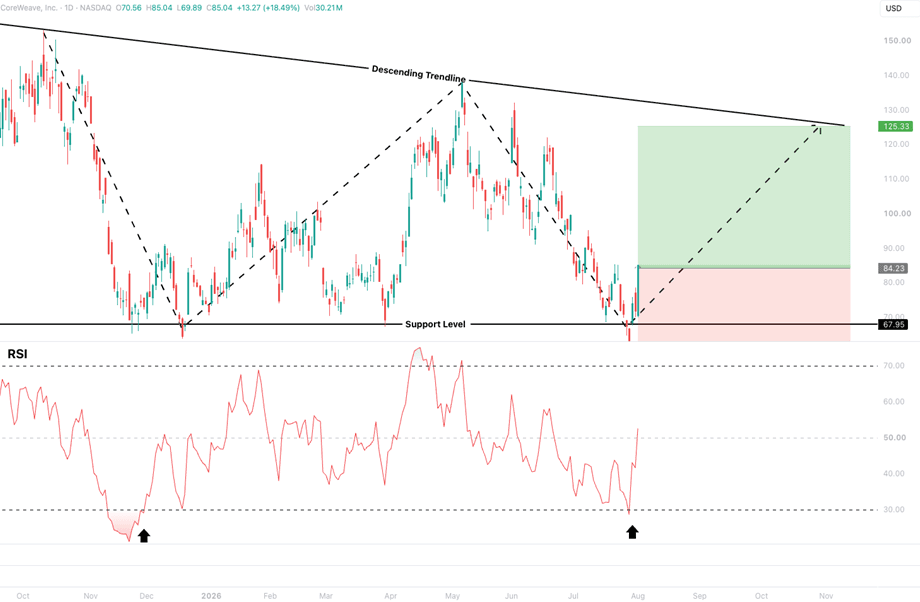
The share is testing major support around $68, a level where buyers have historically stepped in, while overhead resistance comes from a descending trendline that caps each rally. That places the price in a compression between horizontal support below and falling resistance above. The relative strength index (RSI) has lifted off oversold territory and is heading higher, a shift that has historically preceded moves back up toward the trendline. So the near-term bias favours a bounce off $68 toward descending resistance; a decisive break above that trendline would be needed to signal a genuine trend change rather than another rally into resistance.
A potential Buy/Long idea can be initiated with the target set at $125.33 and the stop loss at $60.44.
AST SpaceMobile, Inc. (ASTS): AST SpaceMobile is building a broadband cellular network in space to operate directly with standard, unmodified mobile devices based on an intellectual property and patent portfolio. It focuses on providing mobile broadband services with global coverage to all end users, without the need to purchase special equipment.
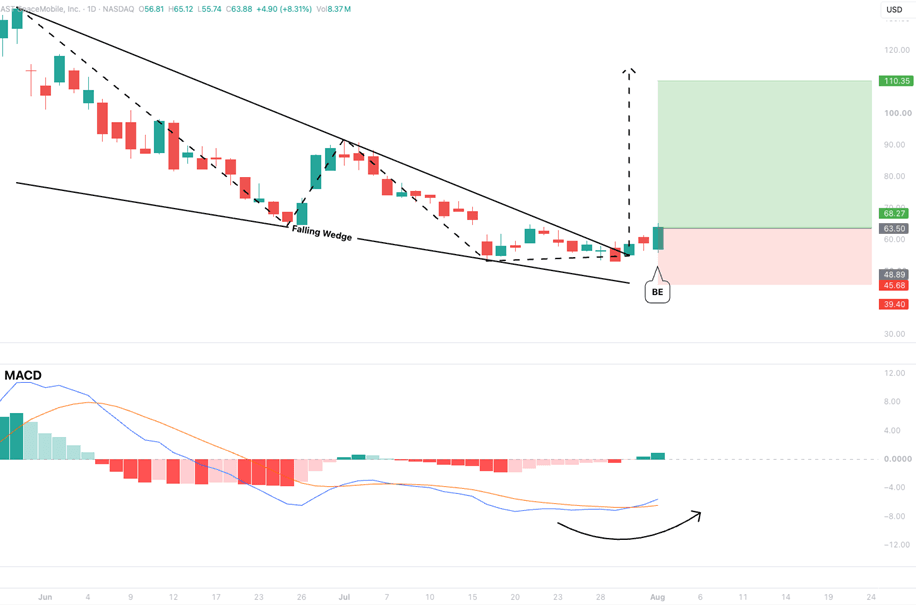
A falling wedge has been confirmed by a bullish breakout. The price has broken above the wedge's upper trendline, completing a pattern where a narrowing decline gives way to an upside reversal as sellers lose control. Adding conviction, Monday's session printed a bullish engulfing candle, where buyers fully overwhelmed the prior day's selling, a strong signal that demand has taken over at these levels. The MACD reinforces the move with a fresh bullish crossover, pushing above its signal line to show momentum has turned positive in step with the breakout.
A potential Buy/Long idea can be initiated with the target set at $110.35 and the stop loss at $45.68.
Meta Platforms, Inc. (META): Meta develops social media applications. It builds technology that helps people connect and share, find communities, and grow businesses.
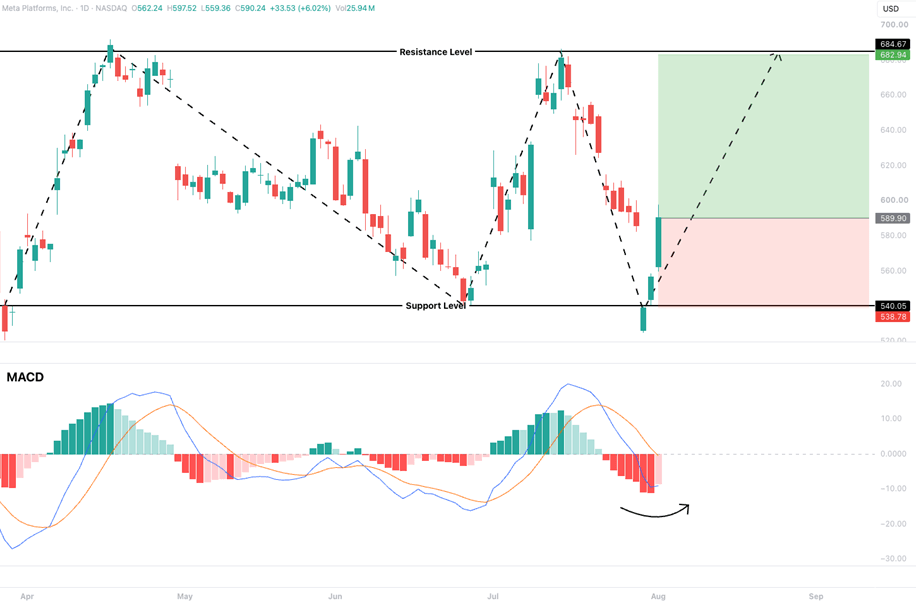
The share has been ranging between resistance at $684 and support at $540. It has just tested the $540 support and turned higher, showing buyers defended the floor of the range once again. The MACD is poised for a bullish crossover, with the MACD line about to push above its signal line. The near-term bias favours a move back toward the top of the range at $684; a decisive break above that level would be needed to signal a genuine breakout rather than another swing within the range.
A potential Buy/Long idea can be initiated with the target set at $682.94 and the stop loss at $538.78.
Disclaimer:
*Any opinions, views, analysis, or other information provided in this article is provided by BROKSTOCK SA trading as BROKSTOCK as general market commentary and should not be viewed as advice according to the FAIS Act of 2002. BROKSTOCK SA does not warrant the correctness, accuracy, timeliness, reliability, or completeness of any information provided by third parties. You must rely upon your judgement in all aspects of your investment decisions, and all decisions are made at your own risk. BROKSTOCK SA and any of its employees shall not be responsible for and will not accept any liability for any direct or indirect loss, including, without limitation, any loss of profit which may arise directly or indirectly from the use of the market commentary. The content contained within the article is subject to change at any time without notice. BROKSTOCK SA is an authorised financial services provider - FSP No. 51404. T&Cs and Disclaimers are applicable: https://brokstock.co.za/
** This article was prepared by BROKSTOCK analyst Maboko Seabi
Read also






© 2026 BROKSTOCK SA (PTY) LTD.
BROKSTOCK SA (PTY) LTD is an authorised Financial Service Provider and is regulated by the South African Financial Sector Conduct Authority (FSP No.51404). BROKSTOCK SA (PTY) LTD Proprietary Limited trading as BROKSTOCK. BROKSTOCK SA (PTY) LTD t/a BROKSTOCK acts solely as an intermediary in terms of the FAIS Act, rendering only an intermediary service (i.e., no market making is conducted by BROKSTOCK SA (PTY) LTD t/a BROKSTOCK) in relation to derivative products (CFDs) offered by the liquidity providers. Therefore, BROKSTOCK SA (PTY) LTD t/a BROKSTOCK does not act as the principal or the counterparty to any of its transactions.
The materials on this website (the “Site”) are intended for informational purposes only. Use of and access to the Site and the information, materials, services, and other content available on or through the Site (“Content”) are subject to the laws of South Africa.
Risk notice Margin trading in financial instruments carries a high level of risk, and may not be suitable for all users. It is essential to understand that investing in financial instruments requires extensive knowledge and significant experience in the investment field, as well as an understanding of the nature and complexity of financial instruments, and the ability to determine the volume of investment and assess the associated risks. BROKSTOCK SA (PTY) LTD pays attention to the fact that quotes, charts and conversion rates, prices, analytic indicators and other data presented on this website may not correspond to quotes on trading platforms and are not necessarily real-time nor accurate. The delay of the data in relation to real-time is equal to 15 minutes but is not limited. This indicates that prices may differ from actual prices in the relevant market, and are not suitable for trading purposes. Before deciding to trade the products offered by BROKSTOCK SA (PTY) LTD, a user should carefully consider his objectives, financial position, needs and level of experience. The Content is for informational purposes only and it should not construe any such information or other material as legal, tax, investment, financial, or other advice. BROKSTOCK SA (PTY) LTD will not accept any liability for loss or damage as a result of reliance on the information contained within this Site including data, quotes, conversion rates, etc.
Third party content BROKSTOCK SA (PTY) LTD may provide materials produced by third parties or links to other websites. Such materials and websites are provided by third parties and are not under BROKSTOCK SA (PTY) LTD's direct control. In exchange for using the Site, the user agrees not to hold BROKSTOCK SA (PTY) LTD, its affiliates or any third party service provider liable for any possible claim for damages arising from any decision user makes based on information or other Content made available to the user through the Site.
Limitation of liability The user’s exclusive remedy for dissatisfaction with the Site and Content is to discontinue using the Site and Content. BROKSTOCK SA (PTY) LTD is not liable for any direct, indirect, incidental, consequential, special or punitive damages. Working with BROKSTOCK SA (PTY) LTD you are trading share CFDs. When trading CFDs on shares you do not own the underlying asset. Share CFDs are complex instruments and come with a high risk of losing money rapidly due to leverage. A high percentage of retail traders accounts lose money when trading CFDs with their provider. All rights reserved. Any use of Site materials without permission is prohibited.