Forex Chart Patterns

Welcome to our comprehensive guide on Forex chart patterns! Here, a BROKSTOCK analyst will delve into the world of chart patterns and explore how they can be utilised to enhance your Forex trading strategies. Here are valuable insights and practical tips to help you navigate the complexities of chart patterns in the Forex market.
What do Forex Chart Patterns Mean?
Forex chart patterns refer to specific formations that occur on price charts, providing valuable information about future price movements. These patterns are visual representations of market sentiment and can be observed across different timeframes. By understanding and correctly interpreting these patterns, traders can gain an edge in predicting potential price trends and making informed trading decisions.
What are the Types of Forex Chart Patterns?
Continuation chart patterns Forex indicate a temporary pause in an ongoing trend before the price resumes its previous direction. These patterns suggest that the market is taking a break before continuing its established trend. Here are some common continuation chart patterns:
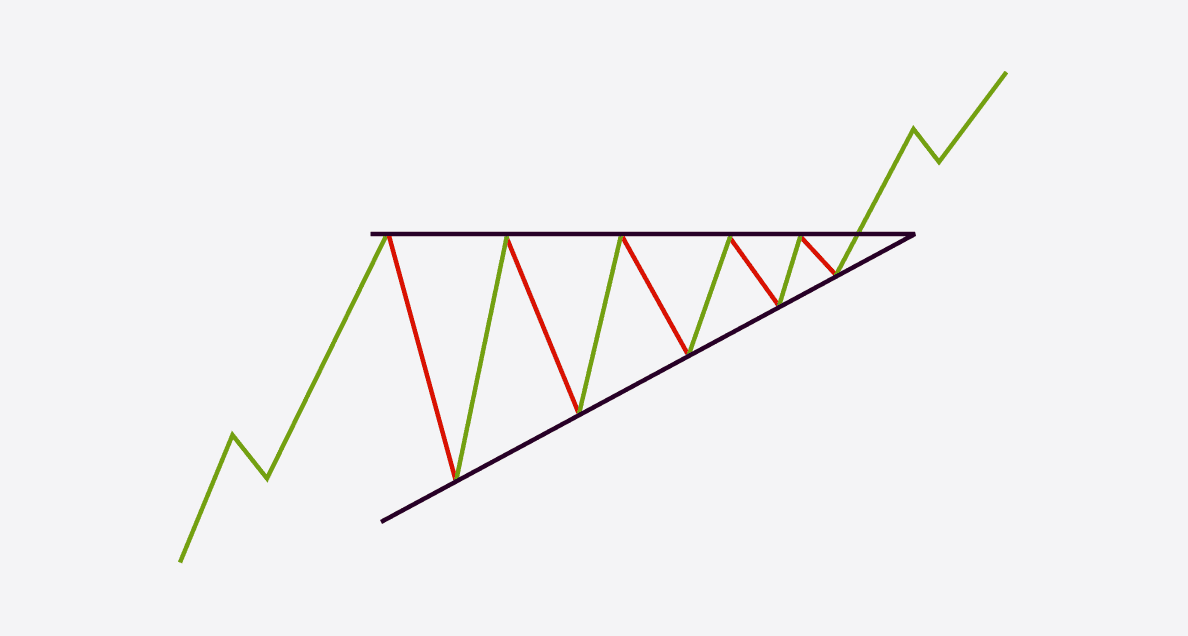
Ascending Triangle: The ascending triangle is a bullish continuation pattern characterised by a flat upper trendline and a rising lower trendline. It represents a period of consolidation before an upward breakout occurs. Traders often look for increasing volume during the breakout to confirm the pattern's validity.
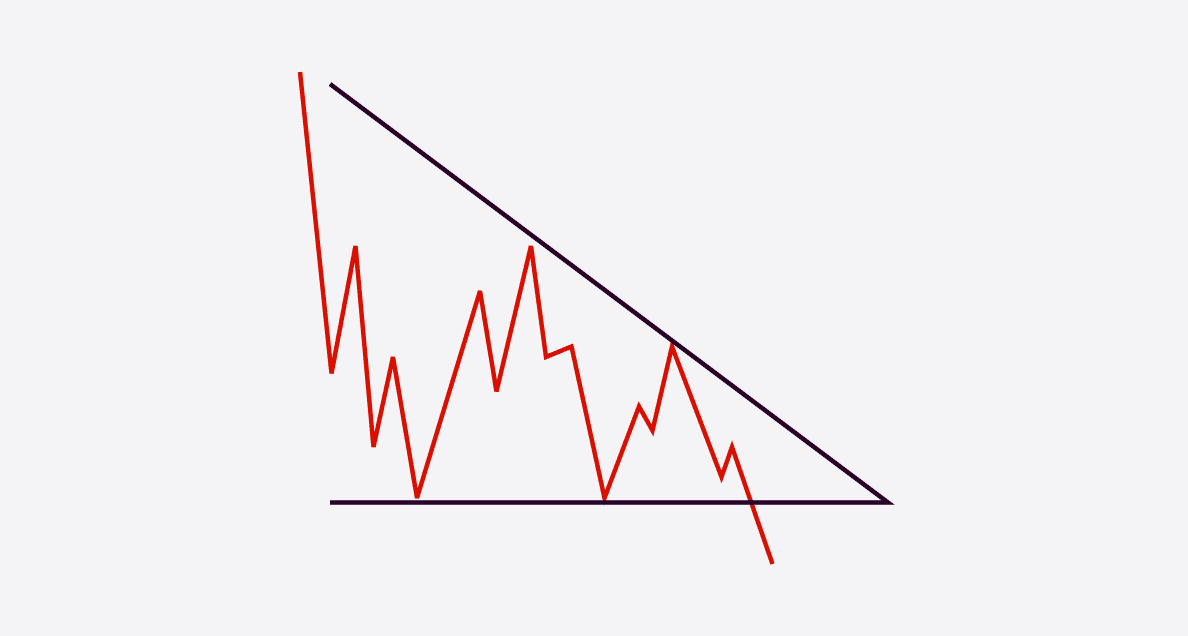
Descending Triangle: The descending triangle is a bearish continuation pattern opposite to the ascending triangle. It features a flat lower trendline and a declining upper trendline. This pattern suggests a period of consolidation before a downward breakout. Confirmation of the pattern can be sought through higher volume during the breakout.
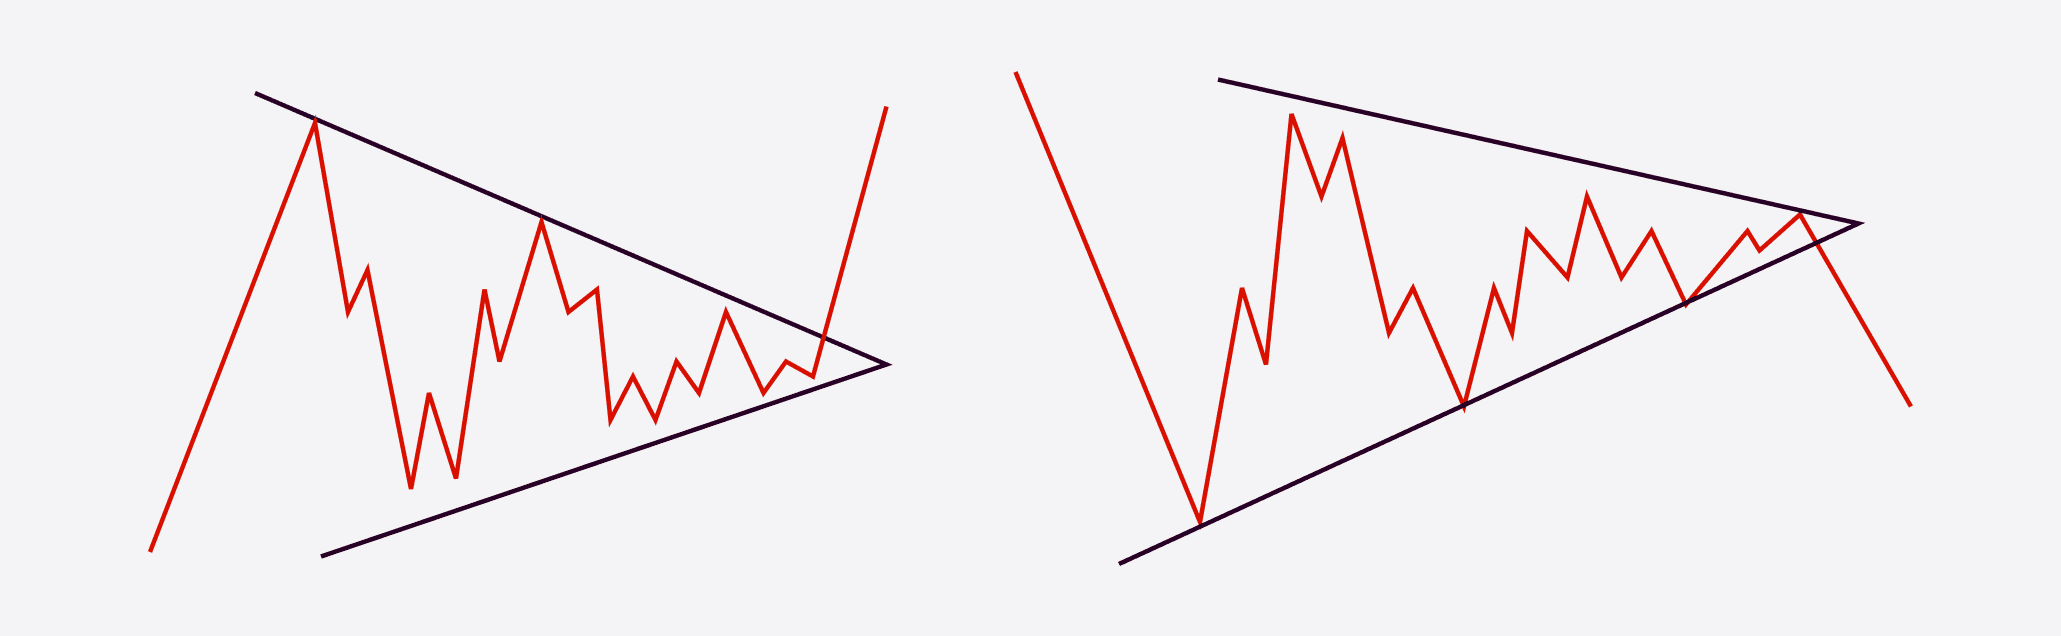
Symmetrical Triangle: The symmetrical triangle is a neutral continuation pattern that occurs when the price forms lower highs and higher lows, creating converging trendlines. This pattern signifies indecision in the market and is often followed by a breakout in the direction of the prevailing trend.
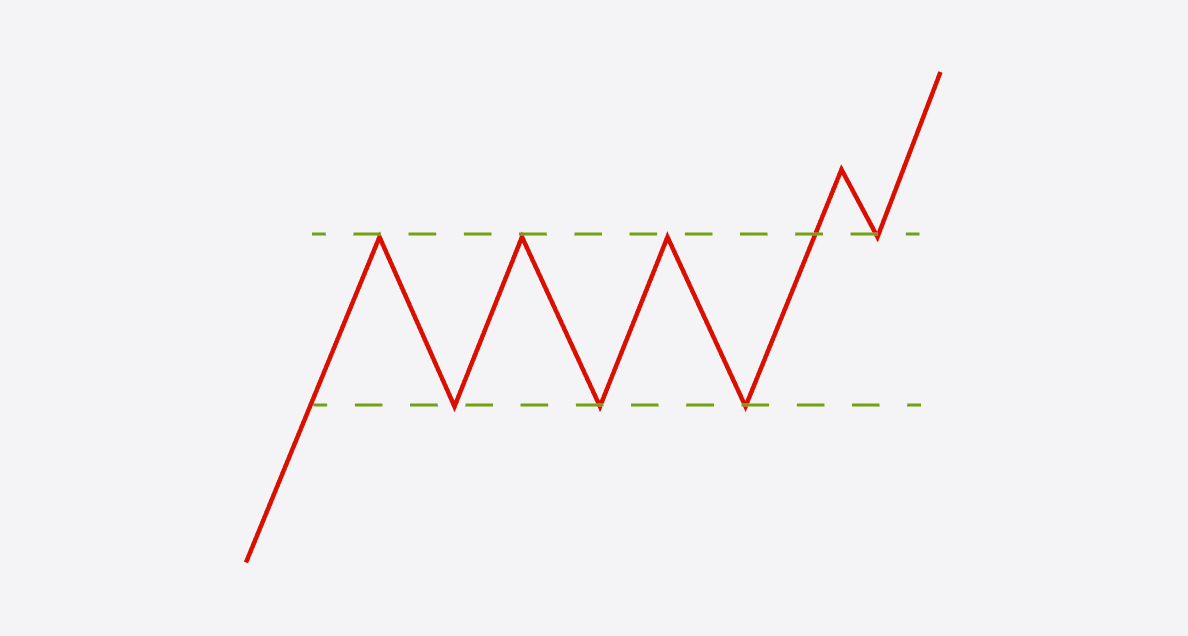
Bullish Rectangle: The bullish rectangle is a continuation pattern that forms when the price consolidates within a horizontal range. It indicates a temporary pause in an uptrend before the price breaks out to the upside, confirming the continuation of the trend.
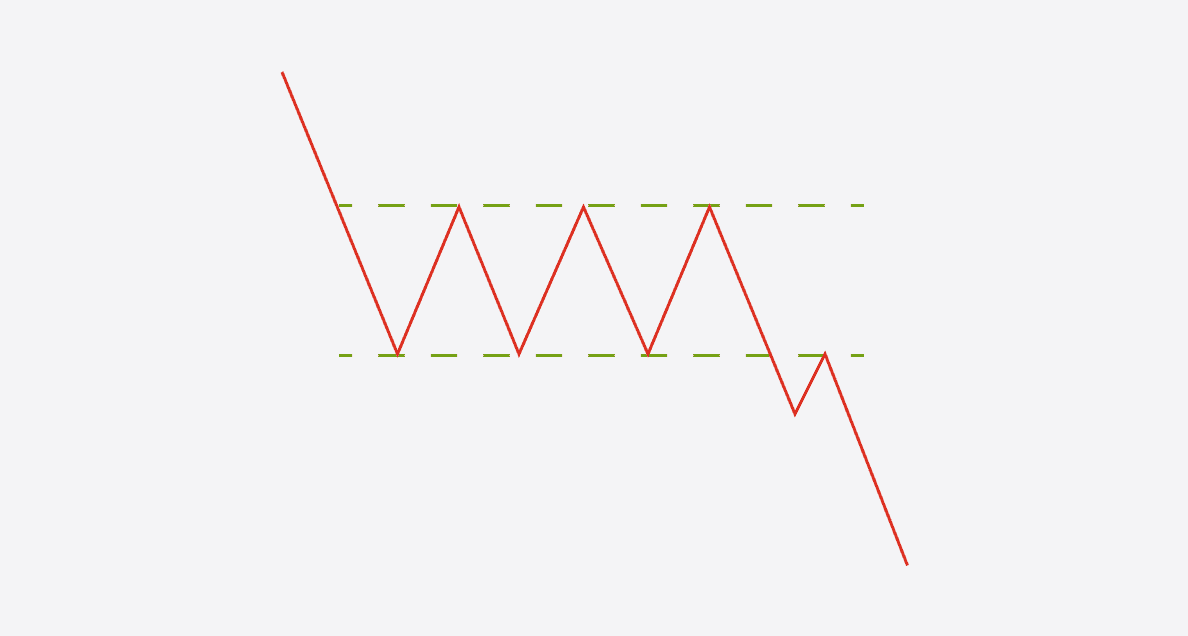
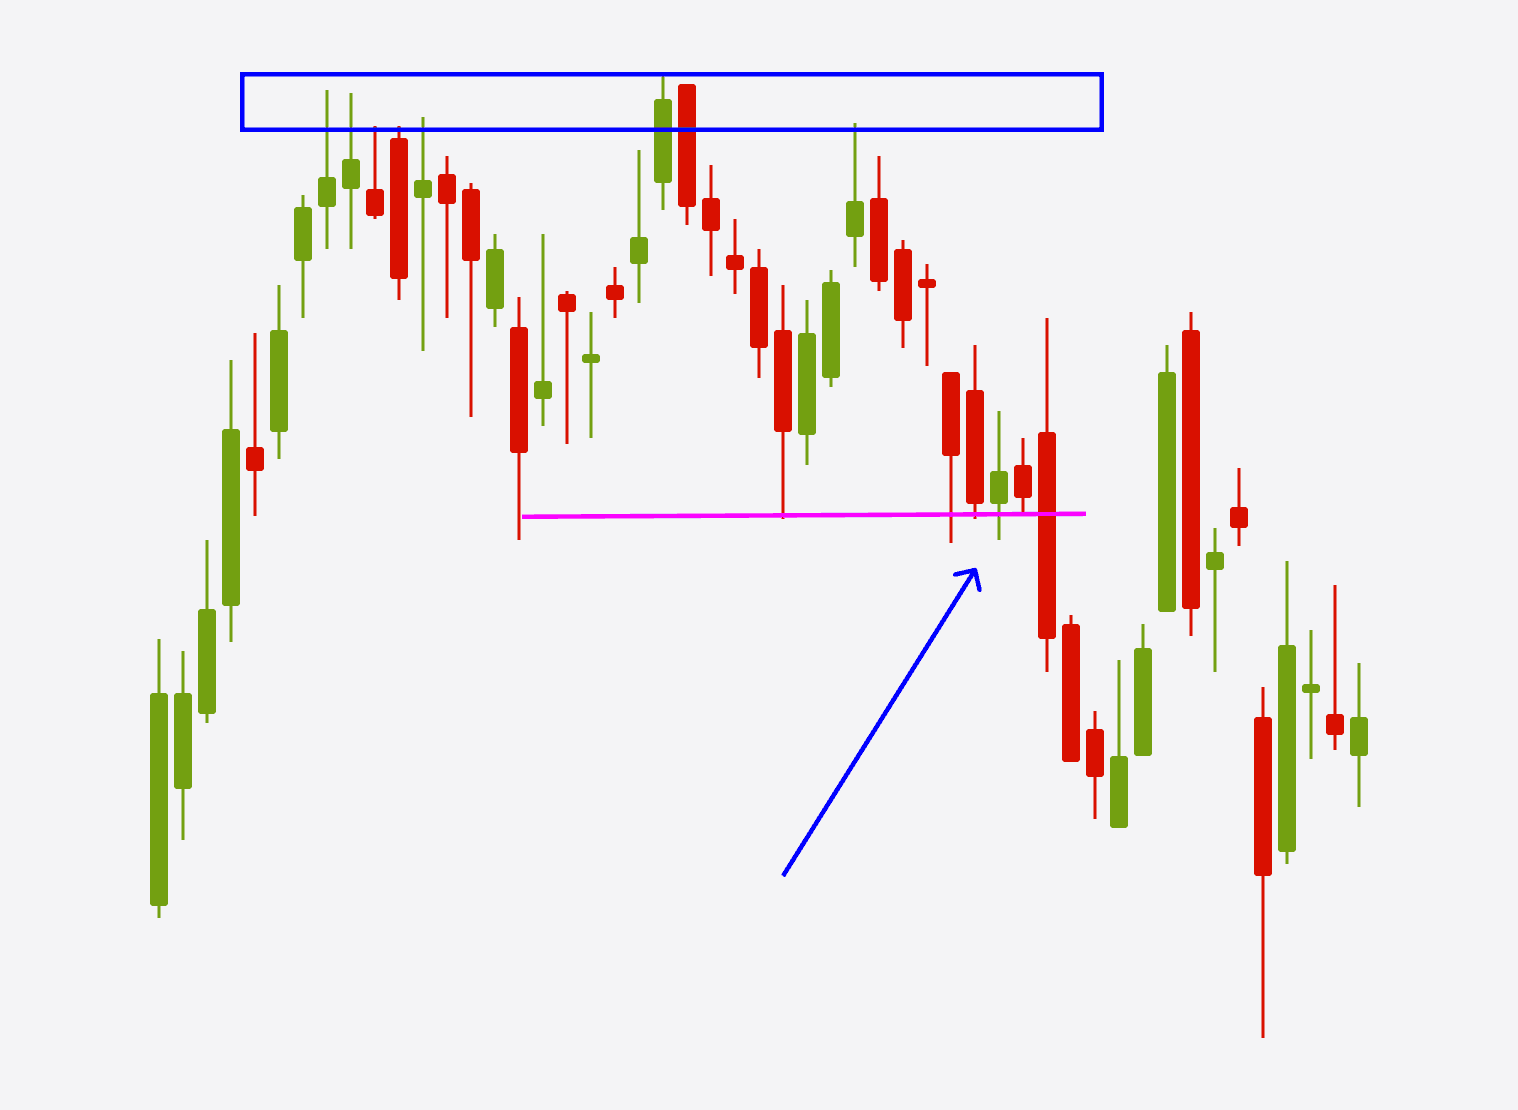
Bearish Rectangle: The bearish rectangle is the opposite of the bullish rectangle. It forms during a downtrend and suggests a temporary consolidation before the price breaks out to the downside, resuming the downward trend.
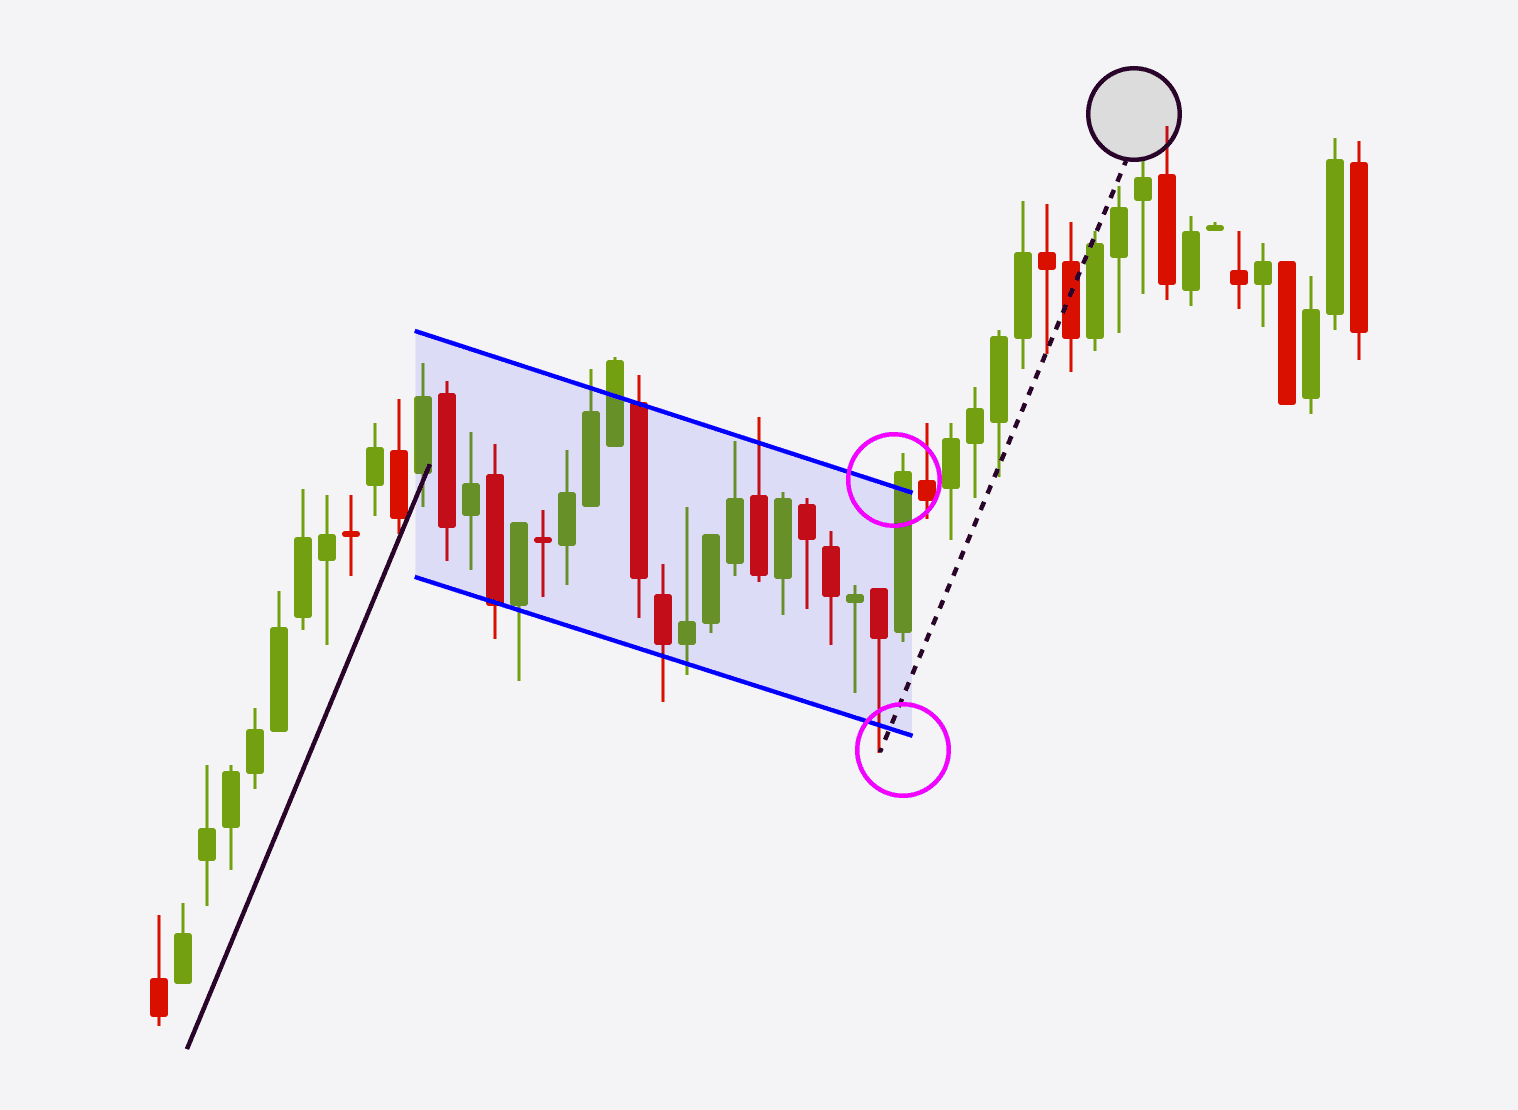
Bull Flag: The bull flag is a bullish continuation pattern that resembles a small rectangle or a pennant. It occurs after a strong upward move, representing a brief period of consolidation before the price continues its ascent. Traders often anticipate a breakout in the direction of the prevailing trend.
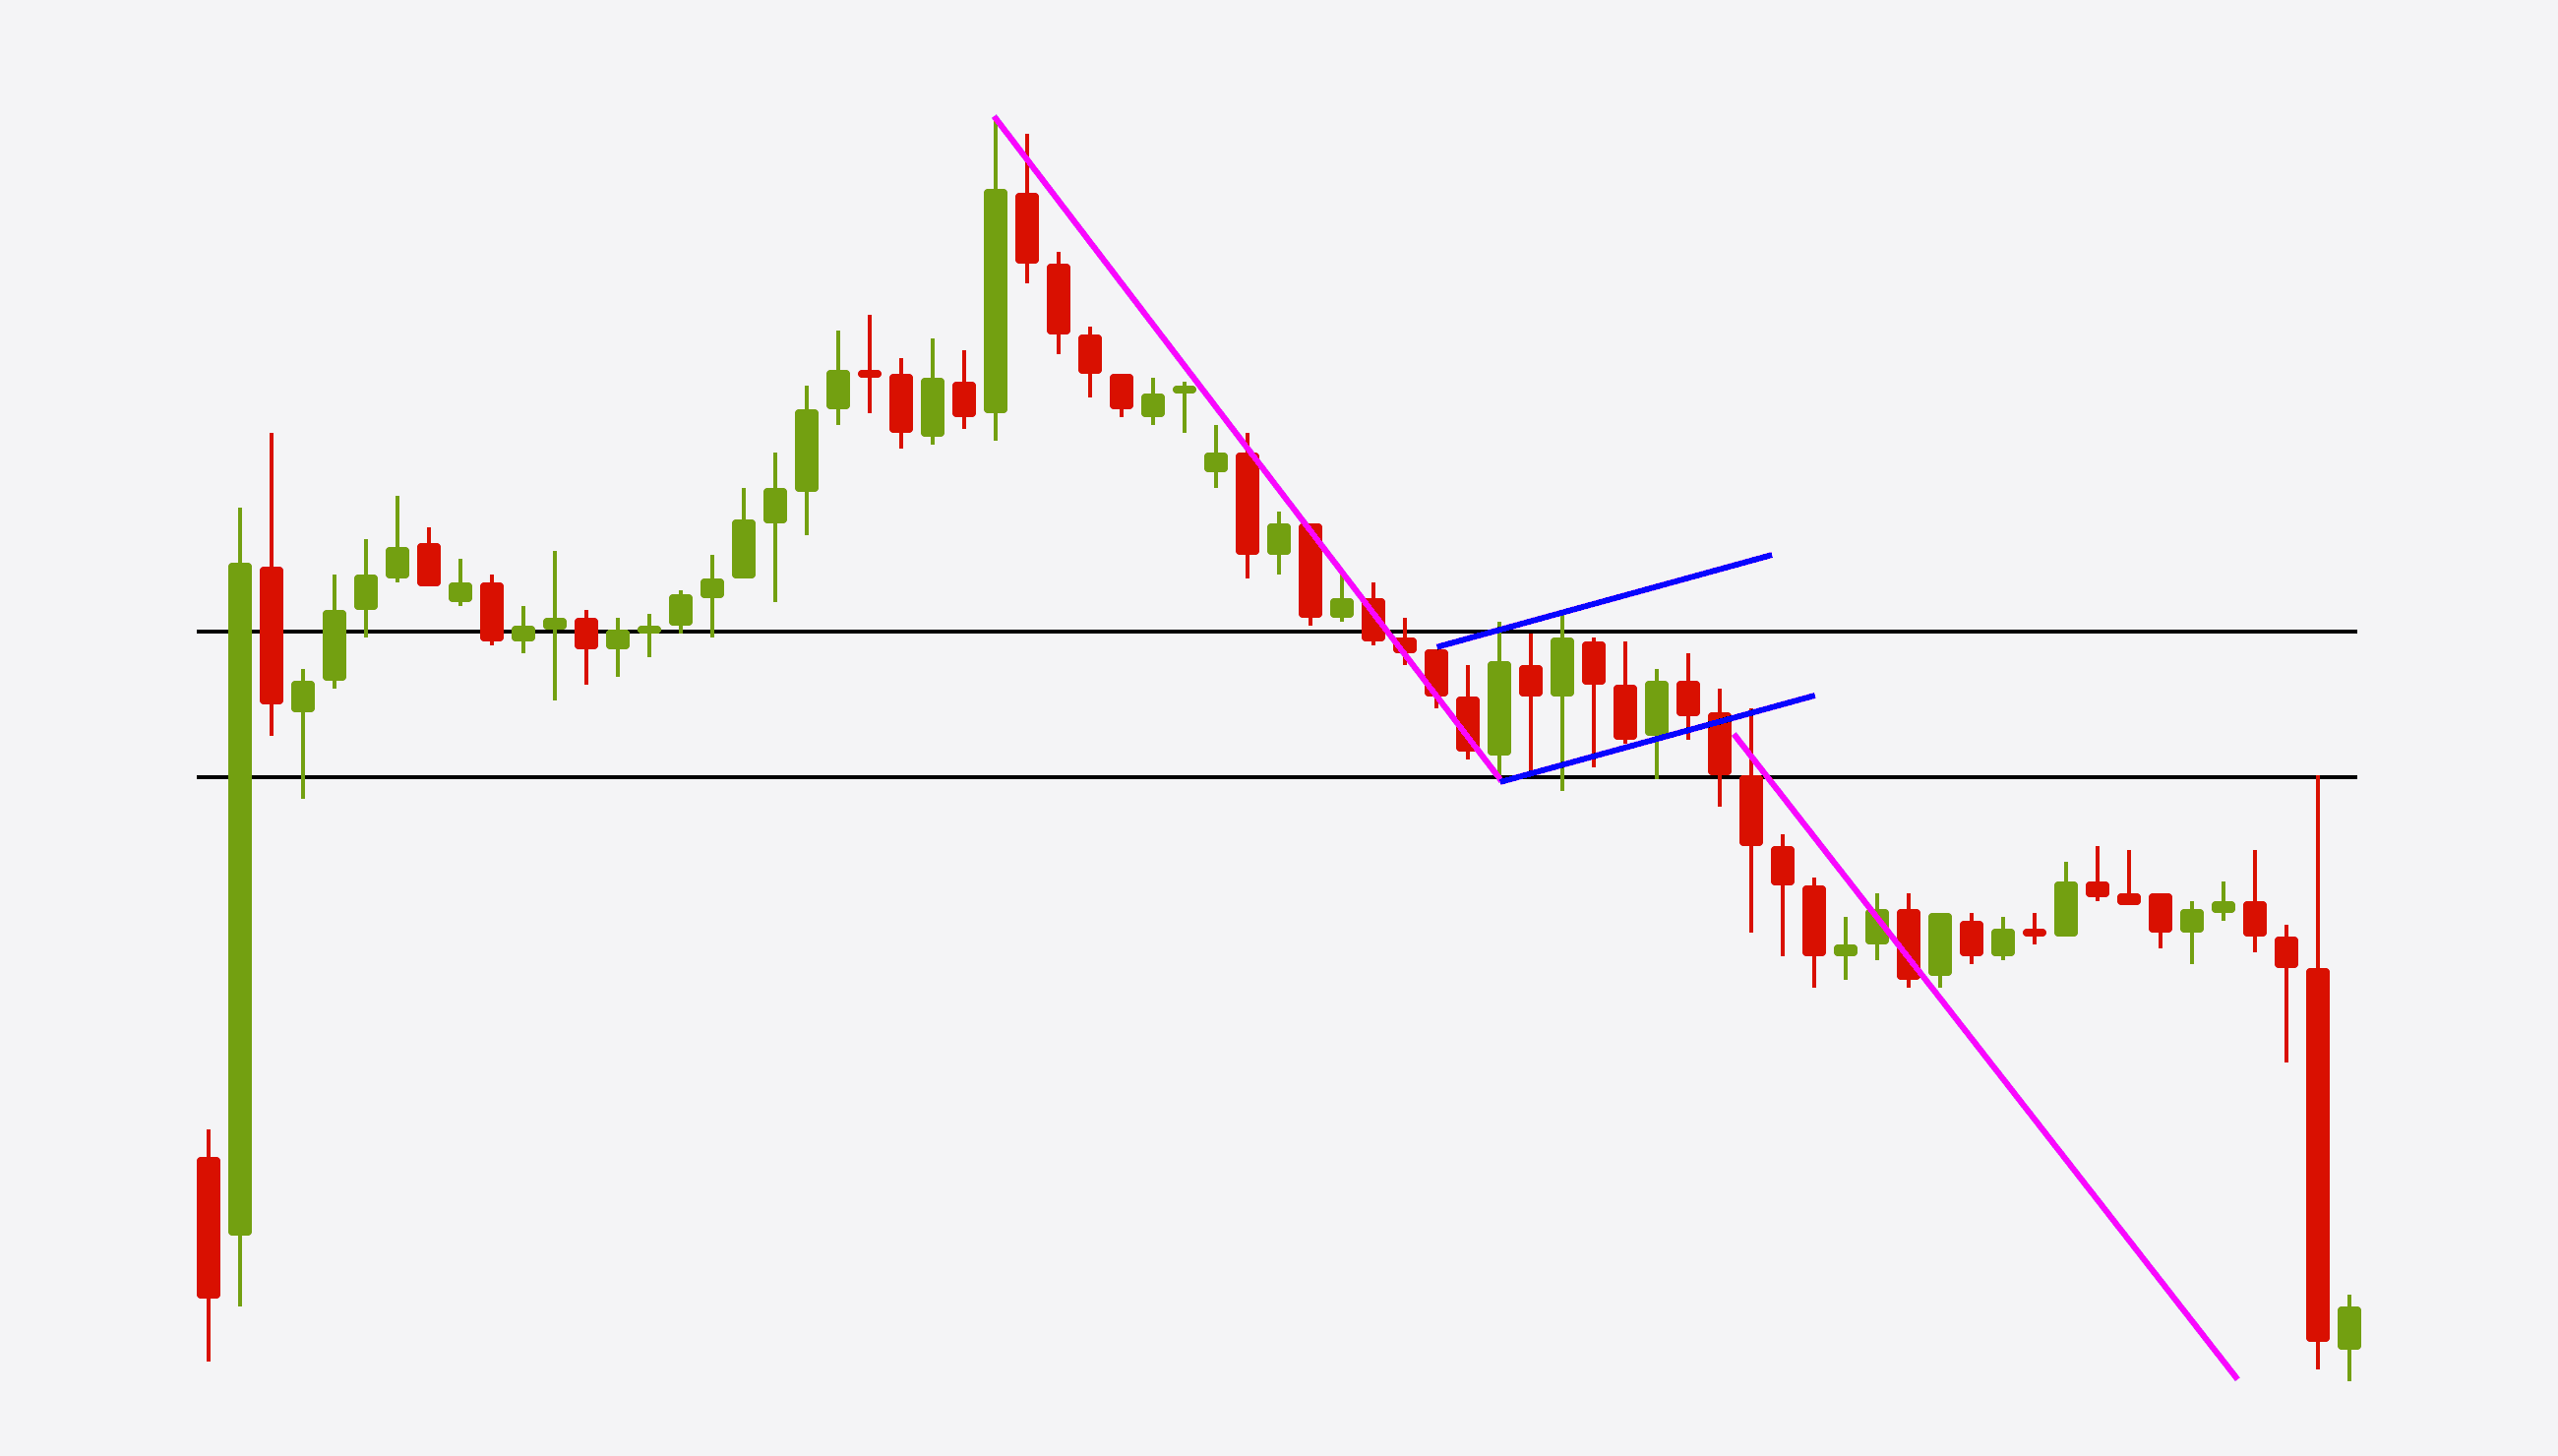
Bear Flag: The bear flag is the counterpart of the bull flag and appears during a downtrend. It indicates a temporary pause in the downward move before the price resumes its decline. Traders typically watch for a breakout to the downside.
Reversal Chart Patterns: Reversal Forex chart patterns indicate a potential change in the prevailing trend. These patterns suggest that the ongoing trend is losing momentum and might reverse its direction. Traders use reversal patterns to identify potential entry points for counter-trend trades. Here are some common reversal chart patterns:
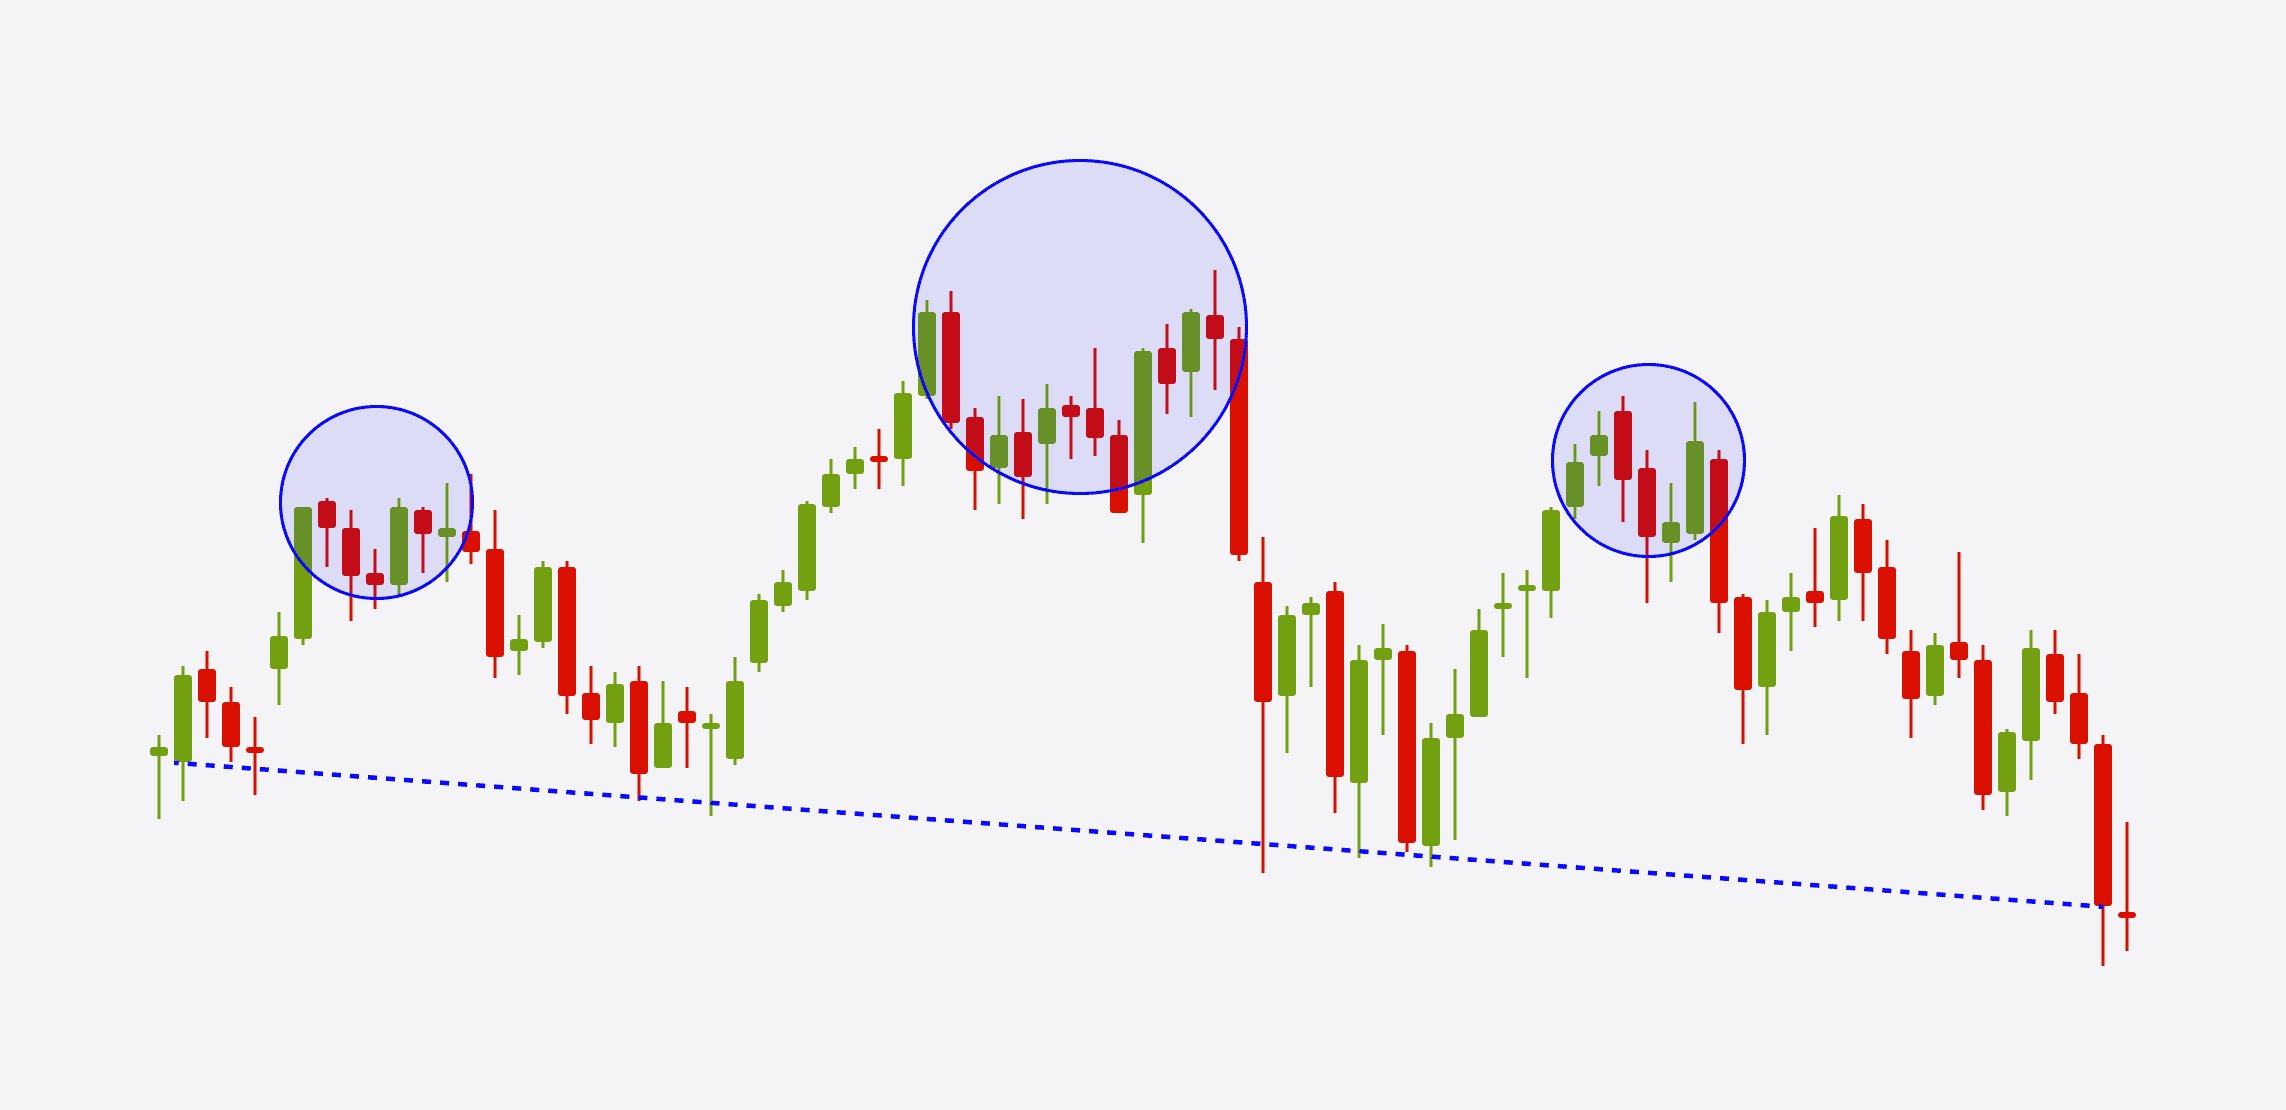
Head and Shoulders: The head and shoulders pattern is a bearish reversal pattern that resembles three peaks, with the middle peak (the head) being the highest. It signifies a shift from an uptrend to a downtrend. Traders often wait for a neckline breakout to confirm the pattern before entering short positions.
Inverse Head and Shoulders: The inverse head and shoulders pattern is the bullish counterpart of the head and shoulders. It consists of three troughs, with the middle trough (the head) being the lowest. This pattern indicates a shift from a downtrend to an uptrend. Traders usually look for a neckline breakout to validate the pattern and initiate long positions.
Triple Top and Triple Bottom: The triple top and triple bottom patterns are similar to the double top and double bottom but feature three price rejections instead of two. These patterns suggest an even stronger reversal signal.
Wedge Pattern: The wedge pattern is a reversal pattern that can be either bullish or bearish. It forms when the price moves within converging trendlines, resembling a triangle with a slanted shape. Traders often anticipate a breakout in the opposite direction of the prevailing trend.
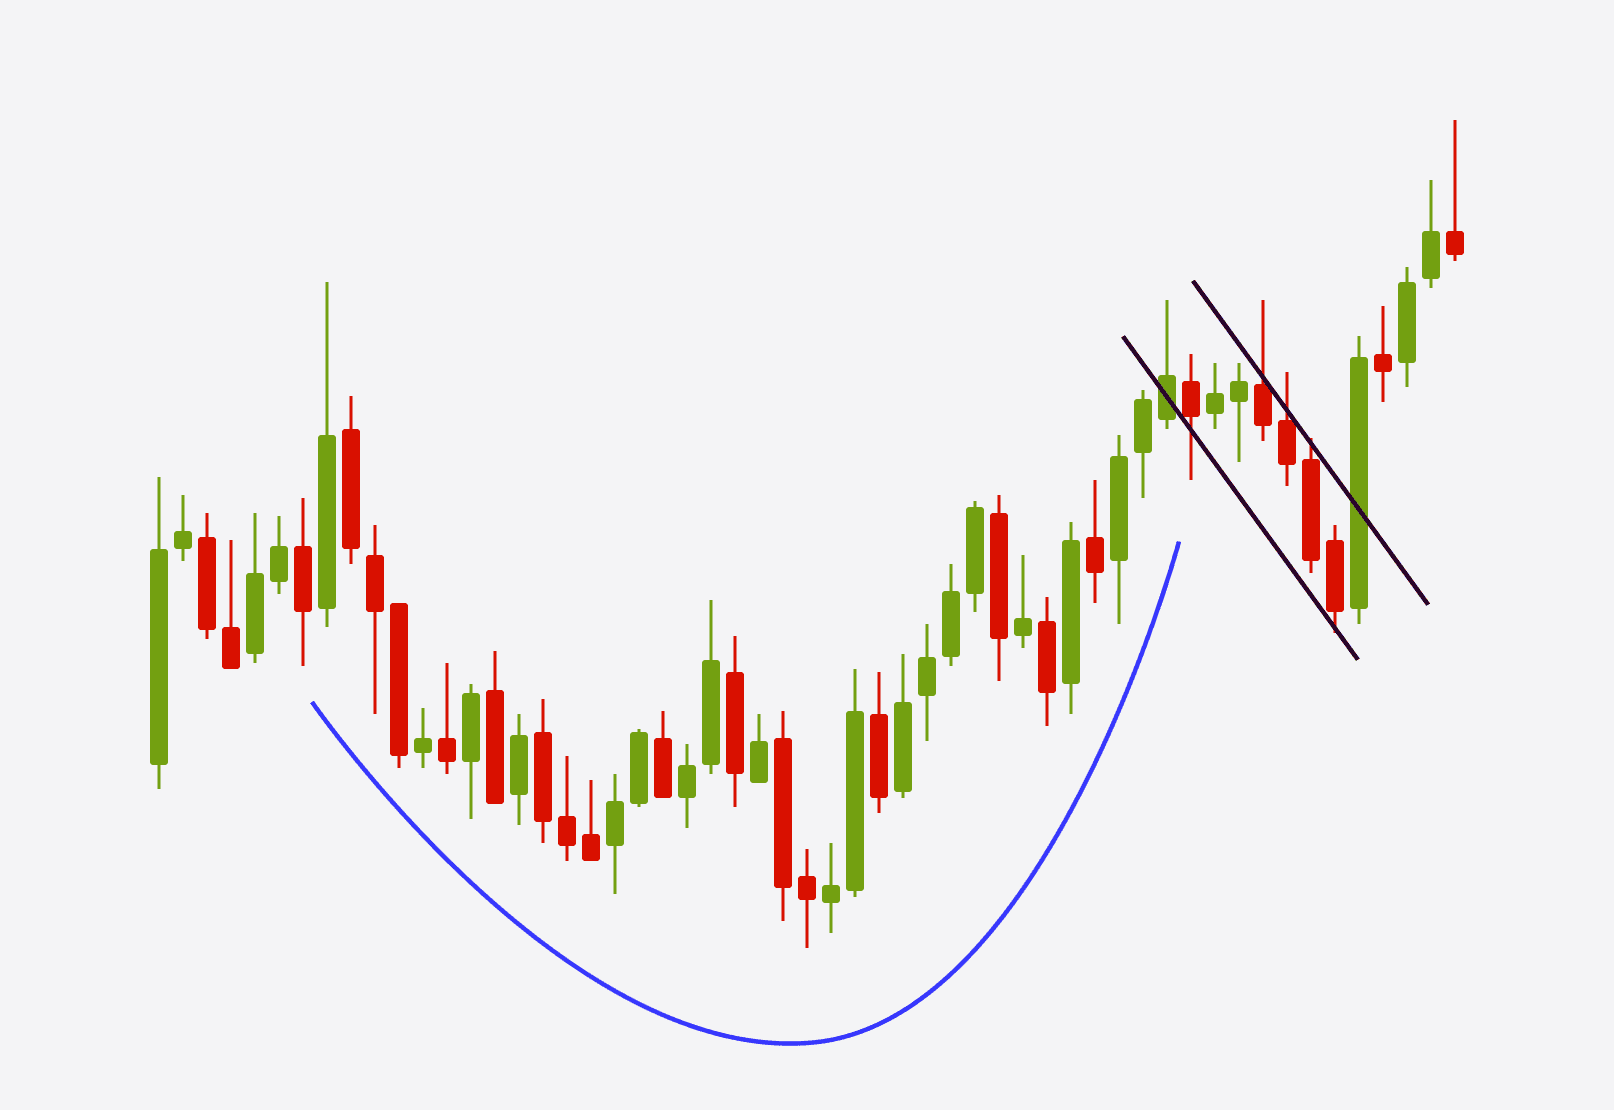
Cup and Handle Pattern: The cup and handle pattern is a bullish reversal pattern that resembles a cup followed by a smaller handle. It indicates a potential trend reversal to the upside. Traders usually enter long positions after a breakout above the handle's resistance level.
Neutral Chart Patterns: Neutral chart patterns Forex indicate a period of consolidation or indecision in the market. These patterns suggest that the price is temporarily moving sideways and not showing a clear trend. Traders can use neutral patterns to anticipate potential breakouts or range-bound trading opportunities. Here are some common neutral chart patterns:
Rectangle Pattern: The rectangle pattern is a neutral pattern formed when the price moves within parallel horizontal lines, creating a rectangle shape. It indicates a balance between buyers and sellers and suggests a potential breakout in either direction.
Pennant Pattern: The pennant pattern is a short-term neutral pattern that resembles a small symmetrical triangle. It occurs after a sharp price movement and indicates a pause before the price continues in the direction of the previous move.
Flag Pattern: The flag pattern is similar to the pennant pattern but features a rectangular shape. It signifies a brief consolidation before the price resumes its previous trend.
How to Use Chart Patterns in Forex Trading?
Effectively utilising chart patterns in Forex trading requires a systematic approach and careful analysis. Here are the steps to incorporate them into your trading strategy:
Identifying chart patterns on Forex charts: Train your eye to spot various chart patterns by studying historical price data and practicing pattern recognition. Familiarise yourself with the visual characteristics and structure of each pattern.
Confirming Forex chart patterns with additional indicators or tools: To increase the reliability of chart patterns, use additional technical indicators or tools, such as moving averages or oscillators, to confirm the validity of the pattern. This helps filter out false signals and improve the accuracy of your trading decisions.
Determining entry and exit points based on patterns: Once a chart pattern is identified and confirmed, determine the optimal entry and exit points for your trades. Utilise support and resistance levels, Fibonacci retracements, or other technical analysis tools to identify potential price targets and stop-loss levels.
Implementing risk management techniques: Managing risk is crucial in trading. Set appropriate stop-loss orders and position sizes based on your risk tolerance. By implementing risk management techniques, you can protect your capital and minimise potential losses.
Continual learning and adaptation: The Forex market is dynamic, and chart patterns may evolve over time. Stay updated with market trends, expand your knowledge, and adapt your trading strategies accordingly. Continual learning and adaptation are key to long-term success in Forex trading.
What are the Drawbacks of Using Chart Patterns?
While chart patterns can provide valuable insights into market trends, it's essential to be aware of their limitations. Here are some drawbacks to consider when relying solely on chart patterns:
False signals and failed patterns: Not all chart patterns lead to successful trades. False signals can occur, resulting in losses. It's crucial to use additional technical analysis tools and indicators to confirm the reliability of a pattern before making trading decisions.
Market volatility and unpredictable price movements: Chart patterns alone may not account for sudden market volatility or unexpected news events that can disrupt price patterns. It's essential to monitor fundamental factors and market conditions alongside chart patterns to make well-informed trading decisions.
Bottom Line and Key Takeaways
Forex chart patterns are valuable tools that can significantly enhance your trading strategies. By understanding the meaning, types, and effective utilisation of chart patterns, you can improve your ability to identify potential price trends and make informed trading decisions. Remember to combine chart patterns Forex with other technical indicators, manage risk effectively, and stay adaptable in a constantly changing market environment.
Maboko brings over 10 years of automated technical analysis and 6+ years of financial market experience to BROKSTOCK. He covers a wide variety of instruments to help investors achieve their long-term and retirement goals. Through his educational content and in-depth analytical analysis, Maboko breaks down complex market data into clear, actionable strategies for sustainable investing.
Becoming proficient in identifying chart patterns requires practice and experience. Study historical price data, use charting tools, and analyse real-time charts to enhance your pattern recognition skills.
Chart patterns can be observed across various timeframes, from minutes to months. Choose a timeframe that aligns with your trading strategy and preferences.
Not all Forex chart patterns lead to successful trades. Evaluate the reliability and strength of a pattern before executing a trade. Consider factors such as the overall market trend, volume, and confirmation from other indicators before making trading decisions.
Read also


© 2026 BROKSTOCK SA (PTY) LTD.
BROKSTOCK SA (PTY) LTD is an authorised Financial Service Provider and is regulated by the South African Financial Sector Conduct Authority (FSP No.51404). BROKSTOCK SA (PTY) LTD Proprietary Limited trading as BROKSTOCK. BROKSTOCK SA (PTY) LTD t/a BROKSTOCK acts solely as an intermediary in terms of the FAIS Act, rendering only an intermediary service (i.e., no market making is conducted by BROKSTOCK SA (PTY) LTD t/a BROKSTOCK) in relation to derivative products (CFDs) offered by the liquidity providers. Therefore, BROKSTOCK SA (PTY) LTD t/a BROKSTOCK does not act as the principal or the counterparty to any of its transactions.
The materials on this website (the “Site”) are intended for informational purposes only. Use of and access to the Site and the information, materials, services, and other content available on or through the Site (“Content”) are subject to the laws of South Africa.
Risk notice Margin trading in financial instruments carries a high level of risk, and may not be suitable for all users. It is essential to understand that investing in financial instruments requires extensive knowledge and significant experience in the investment field, as well as an understanding of the nature and complexity of financial instruments, and the ability to determine the volume of investment and assess the associated risks. BROKSTOCK SA (PTY) LTD pays attention to the fact that quotes, charts and conversion rates, prices, analytic indicators and other data presented on this website may not correspond to quotes on trading platforms and are not necessarily real-time nor accurate. The delay of the data in relation to real-time is equal to 15 minutes but is not limited. This indicates that prices may differ from actual prices in the relevant market, and are not suitable for trading purposes. Before deciding to trade the products offered by BROKSTOCK SA (PTY) LTD, a user should carefully consider his objectives, financial position, needs and level of experience. The Content is for informational purposes only and it should not construe any such information or other material as legal, tax, investment, financial, or other advice. BROKSTOCK SA (PTY) LTD will not accept any liability for loss or damage as a result of reliance on the information contained within this Site including data, quotes, conversion rates, etc.
Third party content BROKSTOCK SA (PTY) LTD may provide materials produced by third parties or links to other websites. Such materials and websites are provided by third parties and are not under BROKSTOCK SA (PTY) LTD's direct control. In exchange for using the Site, the user agrees not to hold BROKSTOCK SA (PTY) LTD, its affiliates or any third party service provider liable for any possible claim for damages arising from any decision user makes based on information or other Content made available to the user through the Site.
Limitation of liability The user’s exclusive remedy for dissatisfaction with the Site and Content is to discontinue using the Site and Content. BROKSTOCK SA (PTY) LTD is not liable for any direct, indirect, incidental, consequential, special or punitive damages. Working with BROKSTOCK SA (PTY) LTD you are trading share CFDs. When trading CFDs on shares you do not own the underlying asset. Share CFDs are complex instruments and come with a high risk of losing money rapidly due to leverage. A high percentage of retail traders accounts lose money when trading CFDs with their provider. All rights reserved. Any use of Site materials without permission is prohibited.