- What Does Breakout Strategy Mean?
- What Does a Resistance Level Mean?
- How to Use a Breakout Entry in Your Trading?
- What Is the Best Indicator For Breakout Strategy?
- Finding a Good Candidate And Breakout Patterns To Look For
- Trendlines
- Channels
- Triangles
- What are the Types of Breakout Strategies?
- What are the Pros and Cons of Breakout Strategy?
- How to Execute Breakout Strategy?
- Entry
- Stop Loss
- Where to Exit With a Profit?
- Where to Exit With a Loss?
- Where to Set a Stop Order?
- Setting a Target
- How to Confirm a Breakout?
- Further Analysis
- Forex Breakout Strategy: The Real Potential
What Is Breakout Strategy In Forex Trading, - Patterns To Look For And Execution
Forex trading's dynamic landscape often calls for strategic approaches, and Breakout Strategy is one such method gaining prominence. This strategy hinges on identifying crucial price levels, like support and resistance, and executing trades when prices 'break out' of these boundaries. In this guide, we'll explore the definition of Breakout Strategy, how to recognise Breakout Patterns, and execute successful trades.
What Does Breakout Strategy Mean?
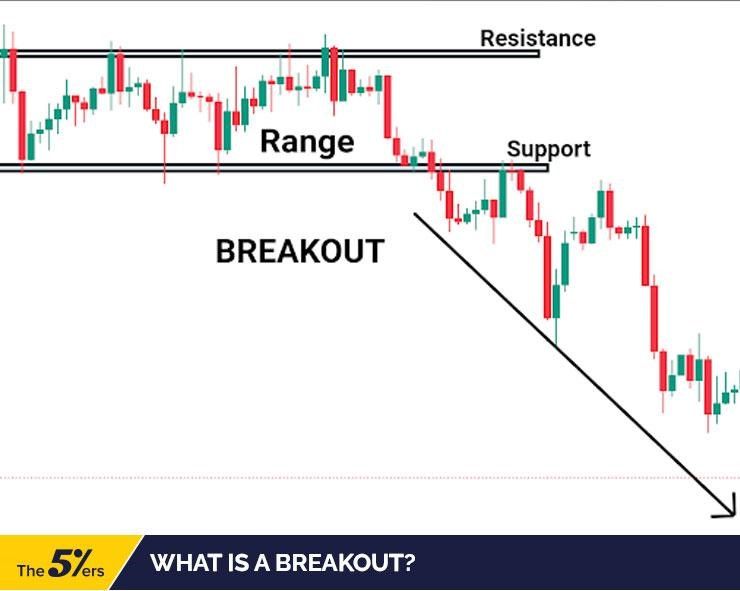
Breakout Strategy in forex trading is based on the assumption that when the price breaks out of a consolidation or a range, it will continue to move in the same direction until it encounters another level of support or resistance. Support and resistance are key concepts in technical analysis that refer to the levels where the price tends to bounce back or reverse due to the presence of buyers or sellers.
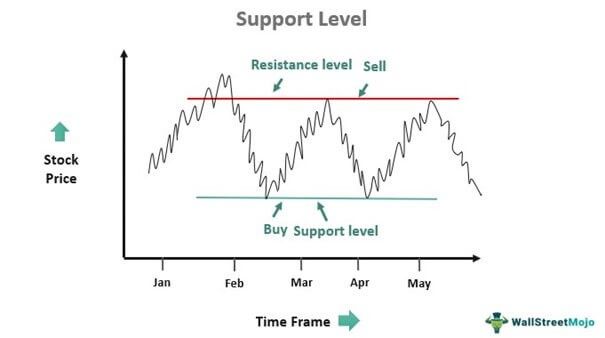
A support level is a price level where the demand for an asset is strong enough to prevent further price declines. When the price reaches a support level, it tends to bounce back or rebound as buyers enter the market or sellers exit the market. A support level can be identified by looking at previous lows, trendlines, moving averages, Fibonacci retracements, or other technical indicators.
What Does a Resistance Level Mean?
A resistance level is a price level where the supply of an asset is strong enough to prevent further price increases. When the price reaches a resistance level, it tends to fall back or reverse as sellers enter the market or buyers exit the market. A resistance level can be identified by looking at previous highs, trendlines, moving averages, Fibonacci extensions, or other technical indicators.
How to Use a Breakout Entry in Your Trading?
A Breakout Entry is a type of entry that involves entering a trade when the price breaks out of a consolidation or a range. It can be used to trade both continuation and reversal Breakouts, depending on the context and the direction of the Breakout.
To use a Breakout Entry in your trading, you need to identify a consolidation or a range on your chart and mark its boundaries with horizontal lines. You also need to determine the direction of the Breakout by looking at the trend, momentum, volume, and other factors. Then, you need to wait for the price to break out of the consolidation or range with a strong candlestick that closes above or below the boundary line. You can enter a trade in the direction of the Breakout as soon as it occurs or wait for a confirmation such as a pullback, a retest, or another candlestick pattern.
What Is the Best Indicator For Breakout Strategy?
There is no definitive answer to whether there is a best indicator for Breakout Strategy, as different indicators may work better for different traders, markets, time frames, and situations. However, some of the common indicators that can be used to enhance this strategy are:
- Trend Indicators: These are indicators that help you identify and follow the direction and strength of the trend. Some examples are moving averages, MACD, ADX, etc.
- Momentum Indicators: These are indicators that help you measure and gauge the speed and force of price movements. Some examples are RSI, Stochastic, CCI, etc.
- Volume Indicators: These are indicators that help you assess and monitor the amount and intensity of trading activity. Some examples are volume bars, OBV, Chaikin Money Flow, etc.
- Volatility Indicators: These are indicators that help you evaluate and anticipate the degree and variation of price fluctuations. Some examples are Bollinger Bands, ATR, Keltner Channels, etc.
You can use these indicators individually or in combination to identify potential support and resistance Breakouts, confirm them, filter false Breakouts, and manage your trades.
Finding a Good Candidate And Breakout Patterns To Look For
Finding a good candidate for Breakout Strategy is not an easy task, as not all consolidations or ranges lead to profitable Breakouts. You need to look for certain criteria and patterns that increase your chances of catching a successful support and resistance Breakout. Some of the factors and patterns to look for are:
- Duration: The longer the consolidation or range lasts, the more likely it is to result in a significant Breakout, as the market builds up more pressure and tension.
- Volatility: The lower the volatility during the consolidation or range, the more likely it is to result in a powerful Breakout, as the market contracts and compresses.
- Volume: The lower the volume during the consolidation or range, the more likely it is to result in a strong Breakout, as the market shows less interest and activity.
- Trend: The stronger the trend before the consolidation or range, the more likely it is to result in a continuation Breakout, as the market resumes its dominant direction.
- Support and Resistance: The more times the price tests the support and resistance levels, the more likely it is to result in a Breakout, as the market weakens the levels and prepares for a break.
Trendlines
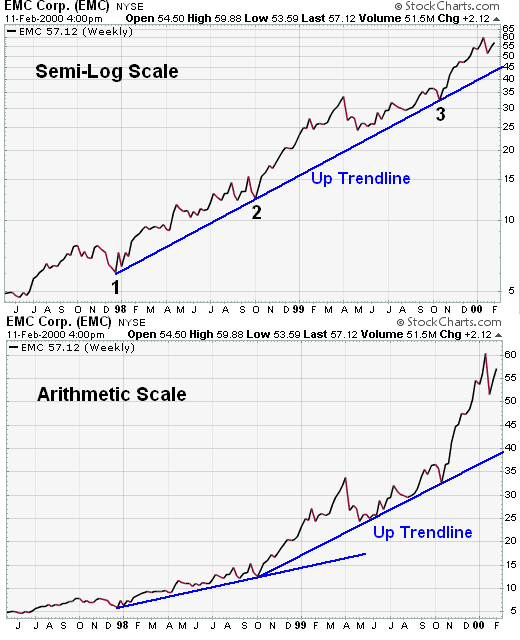
Trendlines Forex are straight lines that connect two or more points on a chart, showing the direction and slope of the price movement. Trendlines can act as dynamic support or resistance levels, depending on whether they are drawn below or above the price. Trendline Forex can help you identify potential Breakouts, as they can form part of consolidation or range patterns.
Channels
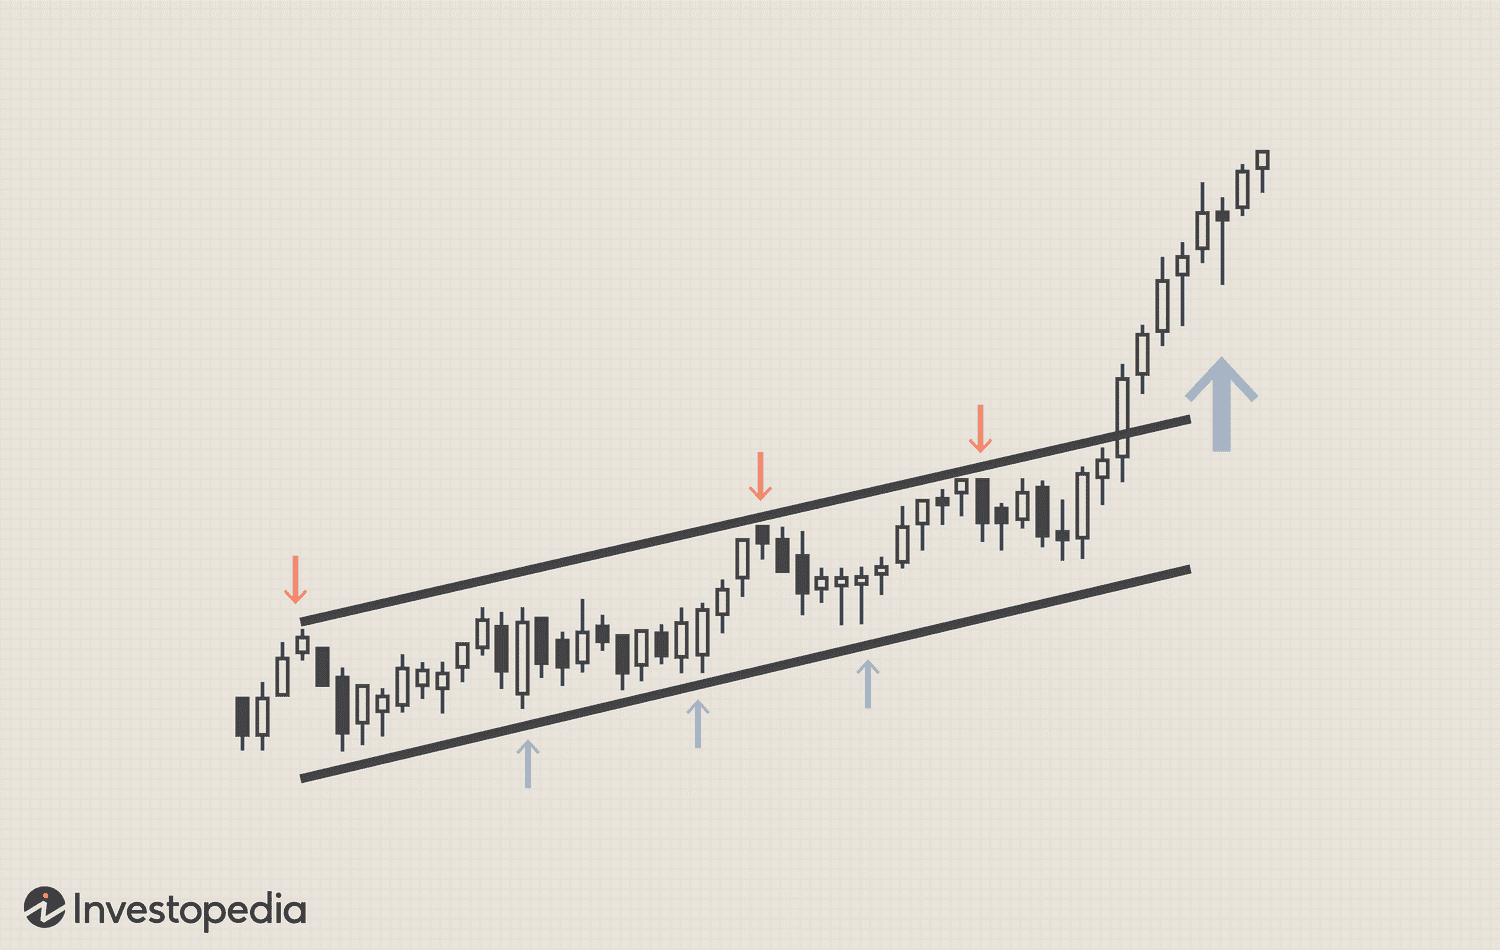
Channels are parallel lines that enclose the price movement, showing both the upper and lower boundaries of a trend. Channels can act as dynamic support and resistance levels. Channels can help you identify potential Breakouts too, as they can also form part of consolidation or range patterns.
Triangles
Triangles are geometric shapes that form when two trendlines converge, creating a narrowing price range. Triangles can act as static support and resistance levels, depending on whether they are drawn below or above the price. Triangles can also help you identify potential Breakouts.
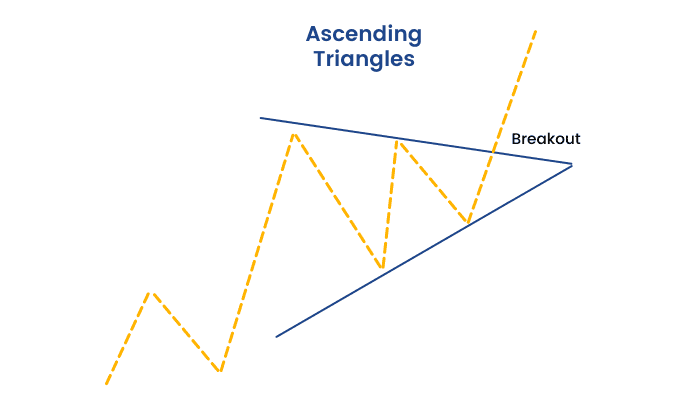
- Ascending Triangles
Ascending triangles are bullish patterns that form when a horizontal resistance line and an ascending support line converge, creating a rising price range. Ascending triangles indicate that buyers are more aggressive than sellers, as they push the price higher within the pattern. Ascending triangles usually result in upward Breakouts, as buyers overcome sellers and break above the resistance line.
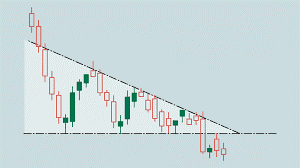
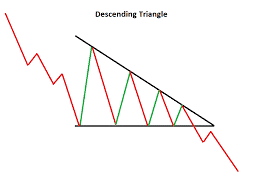
- Descending Triangles
Descending triangles are bearish patterns that form when a horizontal support line and a descending resistance line converge, creating a falling price range. Descending triangles indicate that sellers are more aggressive than buyers, as they push the price lower within the pattern. Descending triangles usually result in downward Breakouts, as sellers overcome buyers and break below the support line.
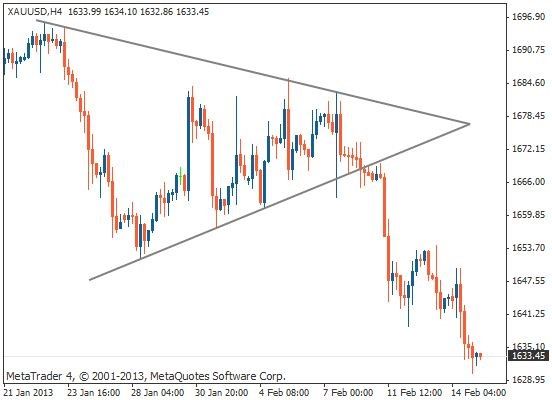
- Symmetrical Triangles
Symmetrical triangles are neutral patterns that form when an ascending resistance line and a descending support line converge, creating a symmetrical price range. Symmetrical triangles indicate that buyers and sellers are equally matched, as they push the price sideways within the pattern. Symmetrical triangles can result in either upward or downward Breakouts, depending on which side of the pattern is broken first.
What are the Types of Breakout Strategies?
There are three main types of Breakout Strategies that you can use to trade forex:
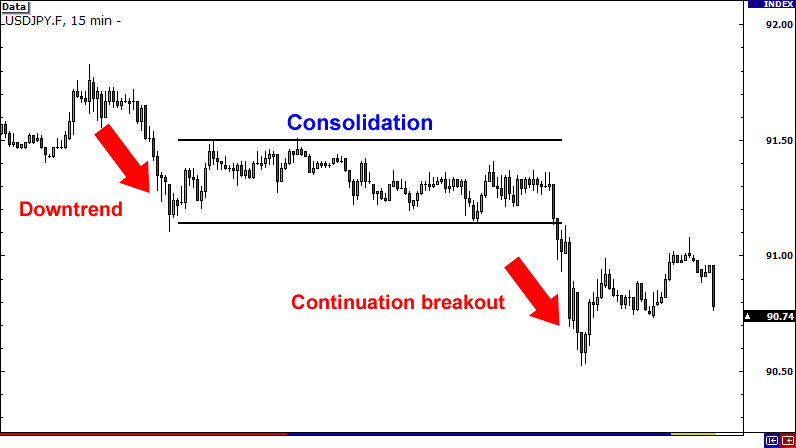
Continuation Breakout Strategy
Continuation Breakout Strategy is a type of Breakout Strategy that involves trading Breakouts that occur in the direction of the prevailing trend. It assumes that when the price breaks out of a consolidation or a range within a trend, it will continue to move in the same direction until it reaches another level of support or resistance. Continuation Breakout Strategy can be used to trade both bullish and bearish Breakouts, depending on whether you are trading an uptrend or a downtrend.
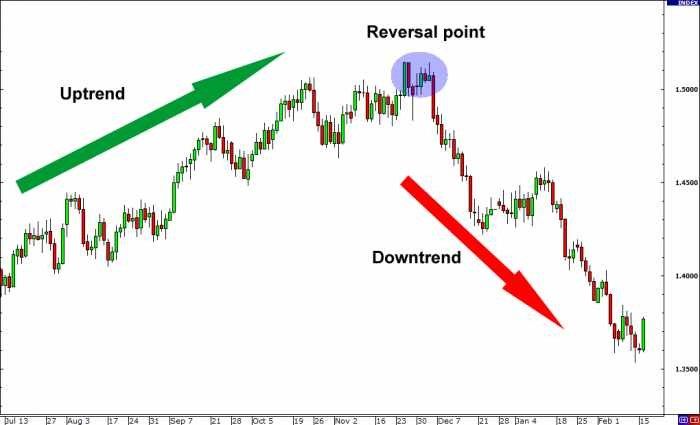
Reversal Breakout Strategy
Reversal Breakout Strategy is a type of Breakout Strategy that involves trading Breakouts that occur in the opposite direction of the prevailing trend. It assumes that when the price breaks out of a consolidation or a range within a trend, it will change its direction and start a new trend in the opposite direction. Reversal Breakout Strategy can be used to trade both bullish and bearish Breakouts, depending on whether you are trading an uptrend or a downtrend.
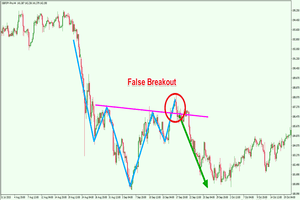
False Breakout Strategy
False Breakout is a type of Breakout in forex that occurs when the price breaks out of a consolidation or a range but fails to sustain its momentum and returns back into the pattern. False Breakout indicates that the market was not ready to choose a direction and was testing the boundaries of the consolidation or range.
What are the Pros and Cons of Breakout Strategy?
A Breakout Trading Strategy has its advantages and disadvantages that you need to be aware of before using it in your forex trading. Some of the pros and cons are:
Pros:
- Capturing large price movements that occur when the market breaks out of a consolidation or a range.
- Trading both continuation and reversal Breakouts, depending on your preference and market conditions.
- Avoiding trading during periods of low volatility and low volume when the market is indecisive or waiting for some catalyst.
- Various indicators and tools used to identify potential Breakouts, confirm them, filter false Breakouts, and manage your trades.
Cons:
- False Breakouts that occur when the market breaks out of a consolidation or a range but fails to sustain its momentum and returns back into the pattern.
- Whipsaws occurring when the market breaks out of a consolidation or a range but quickly reverses its direction and breaks out in the opposite direction.
- Slippage that occurs when the market breaks out of a consolidation or a range with high volatility and high volume, making it difficult to enter or exit trades at your desired price.
- Missed opportunities occurring when the market breaks out of a consolidation or a range without giving you enough time or signals to enter or exit trades.
How to Execute Breakout Strategy?
Executing Breakout Forex Strategy requires you to have a clear plan and a disciplined approach. You need to follow some steps and rules to ensure that you trade Breakouts effectively and efficiently. Some of the steps and rules are:
Entry
To enter a trade using Breakout Forex Strategy, you need to wait for the price to break out of a consolidation or a range with a strong candlestick that closes above or below the boundary line. You can enter a trade in the direction of the Breakout as soon as it occurs or wait for a confirmation such as a pullback, a retest, or another candlestick pattern. You can use indicators such as trend, momentum, volume, and volatility to determine the direction and strength of the breakout.
Stop Loss
To protect your trade from adverse price movements, you need to set a stop loss below or above the boundary line depending on whether you are buying or selling. You can use indicators such as ATR or Bollinger Bands to set your stop loss based on the volatility of the market. You can also use trailing stop loss to lock in your profits as the price moves in your favour.
Where to Exit With a Profit?
To exit your trade with a profit, you need to set a target based on previous support or resistance levels, risk-reward ratios, or other methods. You can use indicators such as Fibonacci extensions or projections to set your target based on the size of the Breakout. You can use trailing take profit to capture more profits as the price moves in your favour, too.
Where to Exit With a Loss?
To exit your trade with a loss, you need to close your trade when your stop loss is hit or when the price moves against your direction and breaks back into the consolidation or range. You can also use indicators such as RSI or Stochastic to exit your trade when the market is overbought or oversold.
Where to Set a Stop Order?
To enter a trade using a stop order, you need to place an order above or below the boundary line depending on whether you are buying or selling. A stop order is an order that is executed when the price reaches a specified level. A stop order can help you enter a trade automatically when the price breaks out of a consolidation or range.
Setting a Target
To set a target using a limit order, you need to place an order below or above your desired exit level depending on whether you are buying or selling. A limit order is an order that is executed when the price reaches a specified level. It can help you exit a trade automatically when the price reaches your target.
How to Confirm a Breakout?
Confirming a Breakout is an important step in trading Breakouts, as it can help you avoid false Breakouts and increase your chances of catching successful ones. It involves using additional signals or criteria to validate that the price has broken out of a consolidation or range and is likely to continue in its direction. Some of the ways to confirm a Breakout are:
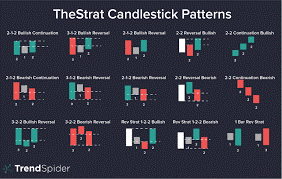
- Candlestick Patterns: You can use candlestick patterns such as engulfing, pin bar, hammer, shooting star, etc. to confirm a Breakout. These patterns can indicate that the price has reversed its direction and has enough momentum to sustain its move.
- Pullback and Retest: You can use pullback and retest to confirm a Breakout. A pullback is when the price retraces back to the boundary line after breaking out of it. A retest is when the price tests the boundary line again but fails to break back into it. A pullback and retest can indicate that the boundary line has switched its role from support to resistance or vice versa and that the price has confirmed its Breakout.
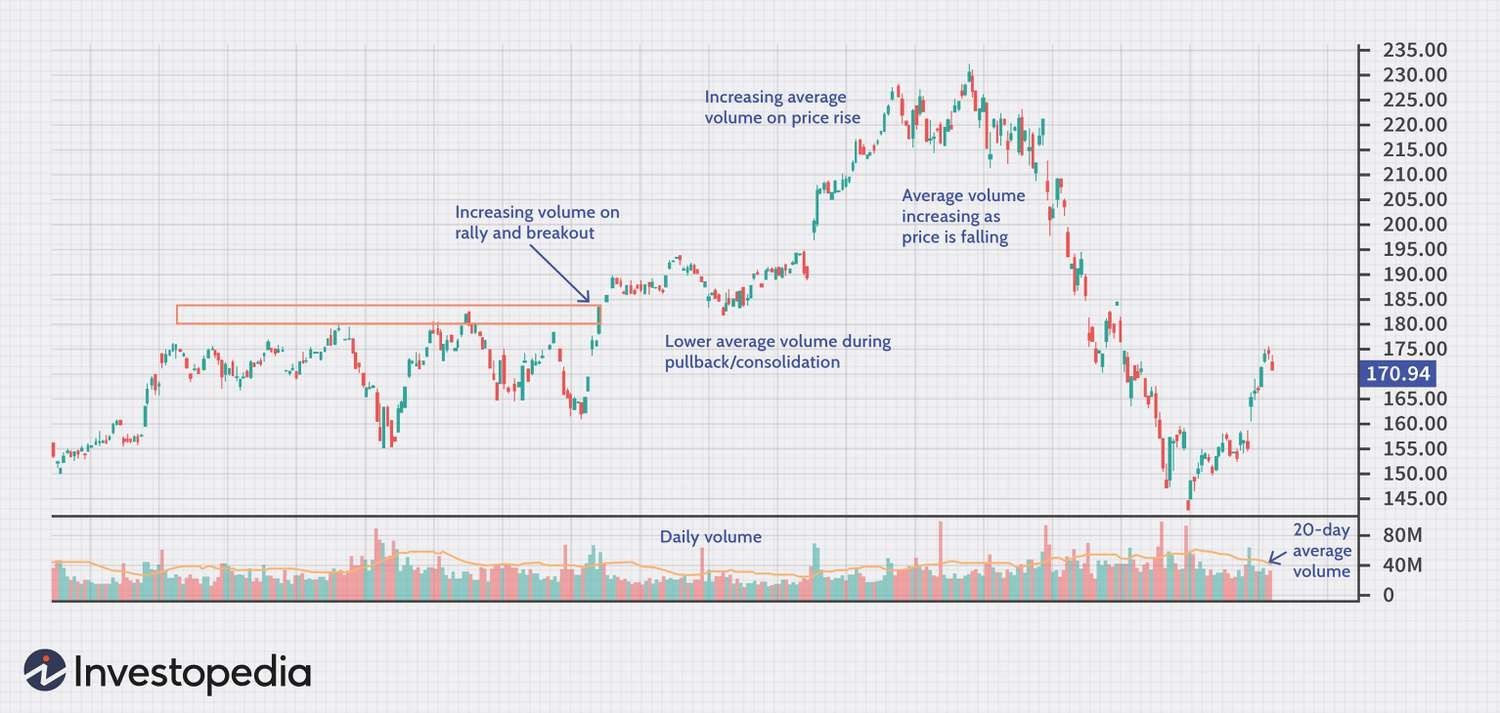
- Volume: You can use volume to confirm a Breakout. Volume is the amount and intensity of trading activity in the market. It can indicate that there is enough interest and participation in the market to support the Breakout. A high volume Breakout can indicate that there is strong demand or supply for an asset and that there is less chance of reversal.
Further Analysis
Further analysis involves using additional tools or methods to analyse various factors that may affect your Breakout trading. Some of the tools and methods for further analysis are:
- Market Sentiment: Market sentiment is the overall attitude and feeling of traders and investors towards an asset or a market. It can influence how traders and investors behave and react to price movements and Breakouts. You can use tools such as sentiment indicators, surveys, polls, etc. to measure and monitor market sentiment and use it to your advantage in trading Breakouts.
- News Events: News events are significant occurrences or announcements that may have an impact on the market or an asset. They can trigger or influence price movements and Breakouts. You can use tools such as economic calendars, news feeds, alerts, etc. to keep track of news events and use them to your advantage in trading Breakouts.
- Economic Data: Economic data are statistics or indicators that reflect the state and performance of an economy or a sector. They can affect the market or an asset by influencing the supply and demand, the interest rates, the inflation, the growth, etc. You can use tools such as economic calendars, reports, charts, etc. to access and analyse economic data and use them to your advantage in trading Breakouts.
Forex Breakout Strategy: The Real Potential
Forex Breakout Strategy is a powerful and versatile strategy that can help you capture large price movements that occur when the market breaks out of a consolidation or a range.
This strategy has its pros and cons that you need to be aware of before using it in your forex trading. It can help you trade both continuation and reversal Breakouts, depending on your preference and market conditions. Forex Breakout Strategy can help you avoid trading during periods of low volatility and low volume when the market is indecisive or waiting for some catalyst. Also, it offers you using various indicators and tools to identify potential Breakouts, confirm them, filter false Breakouts, and manage your trades.
Forex Breakout Strategy can expose you to false Breakouts, whipsaws, slippage, and missed opportunities that may affect your trading results.
This strategy requires you to have a clear plan and a disciplined approach to execute it effectively and efficiently. It has a real potential to help you achieve your trading goals and objectives if you use it correctly and consistently.
Maboko brings over 10 years of automated technical analysis and 6+ years of financial market experience to BROKSTOCK. He covers a wide variety of instruments to help investors achieve their long-term and retirement goals. Through his educational content and in-depth analytical analysis, Maboko breaks down complex market data into clear, actionable strategies for sustainable investing.
Breakout Strategies are reliable if they are used with proper analysis, confirmation, risk management, and discipline.
There is no definitive answer to what is the best time frame to trade Breakouts, as different time frames may suit different traders, markets, situations, and preferences. However, some general guidelines are:
- The higher the time frame, the more significant and reliable the Breakout is likely to be, as it reflects the longer-term trend and direction of the market.
- The lower the time frame, the more frequent and volatile the Breakout is likely to be, as it reflects the shorter-term fluctuations and noise of the market.
- The best time frame to trade Breakouts is the one that matches your trading style, personality, risk tolerance, and goals.
You do not need indicators to trade Breakouts, as you can trade them based on price action alone. However, indicators can help you by providing you with additional information and signals that can help you identify potential Breakouts, confirm them, filter false Breakouts, and manage your trades.
Breakout Trading works if it is done with proper analysis, confirmation, risk management, and discipline.
Read also


© 2026 BROKSTOCK SA (PTY) LTD.
BROKSTOCK SA (PTY) LTD is an authorised Financial Service Provider and is regulated by the South African Financial Sector Conduct Authority (FSP No.51404). BROKSTOCK SA (PTY) LTD Proprietary Limited trading as BROKSTOCK. BROKSTOCK SA (PTY) LTD t/a BROKSTOCK acts solely as an intermediary in terms of the FAIS Act, rendering only an intermediary service (i.e., no market making is conducted by BROKSTOCK SA (PTY) LTD t/a BROKSTOCK) in relation to derivative products (CFDs) offered by the liquidity providers. Therefore, BROKSTOCK SA (PTY) LTD t/a BROKSTOCK does not act as the principal or the counterparty to any of its transactions.
The materials on this website (the “Site”) are intended for informational purposes only. Use of and access to the Site and the information, materials, services, and other content available on or through the Site (“Content”) are subject to the laws of South Africa.
Risk notice Margin trading in financial instruments carries a high level of risk, and may not be suitable for all users. It is essential to understand that investing in financial instruments requires extensive knowledge and significant experience in the investment field, as well as an understanding of the nature and complexity of financial instruments, and the ability to determine the volume of investment and assess the associated risks. BROKSTOCK SA (PTY) LTD pays attention to the fact that quotes, charts and conversion rates, prices, analytic indicators and other data presented on this website may not correspond to quotes on trading platforms and are not necessarily real-time nor accurate. The delay of the data in relation to real-time is equal to 15 minutes but is not limited. This indicates that prices may differ from actual prices in the relevant market, and are not suitable for trading purposes. Before deciding to trade the products offered by BROKSTOCK SA (PTY) LTD, a user should carefully consider his objectives, financial position, needs and level of experience. The Content is for informational purposes only and it should not construe any such information or other material as legal, tax, investment, financial, or other advice. BROKSTOCK SA (PTY) LTD will not accept any liability for loss or damage as a result of reliance on the information contained within this Site including data, quotes, conversion rates, etc.
Third party content BROKSTOCK SA (PTY) LTD may provide materials produced by third parties or links to other websites. Such materials and websites are provided by third parties and are not under BROKSTOCK SA (PTY) LTD's direct control. In exchange for using the Site, the user agrees not to hold BROKSTOCK SA (PTY) LTD, its affiliates or any third party service provider liable for any possible claim for damages arising from any decision user makes based on information or other Content made available to the user through the Site.
Limitation of liability The user’s exclusive remedy for dissatisfaction with the Site and Content is to discontinue using the Site and Content. BROKSTOCK SA (PTY) LTD is not liable for any direct, indirect, incidental, consequential, special or punitive damages. Working with BROKSTOCK SA (PTY) LTD you are trading share CFDs. When trading CFDs on shares you do not own the underlying asset. Share CFDs are complex instruments and come with a high risk of losing money rapidly due to leverage. A high percentage of retail traders accounts lose money when trading CFDs with their provider. All rights reserved. Any use of Site materials without permission is prohibited.